Announcing Insights for Foxglove Data Platform
 Esther Weon ·
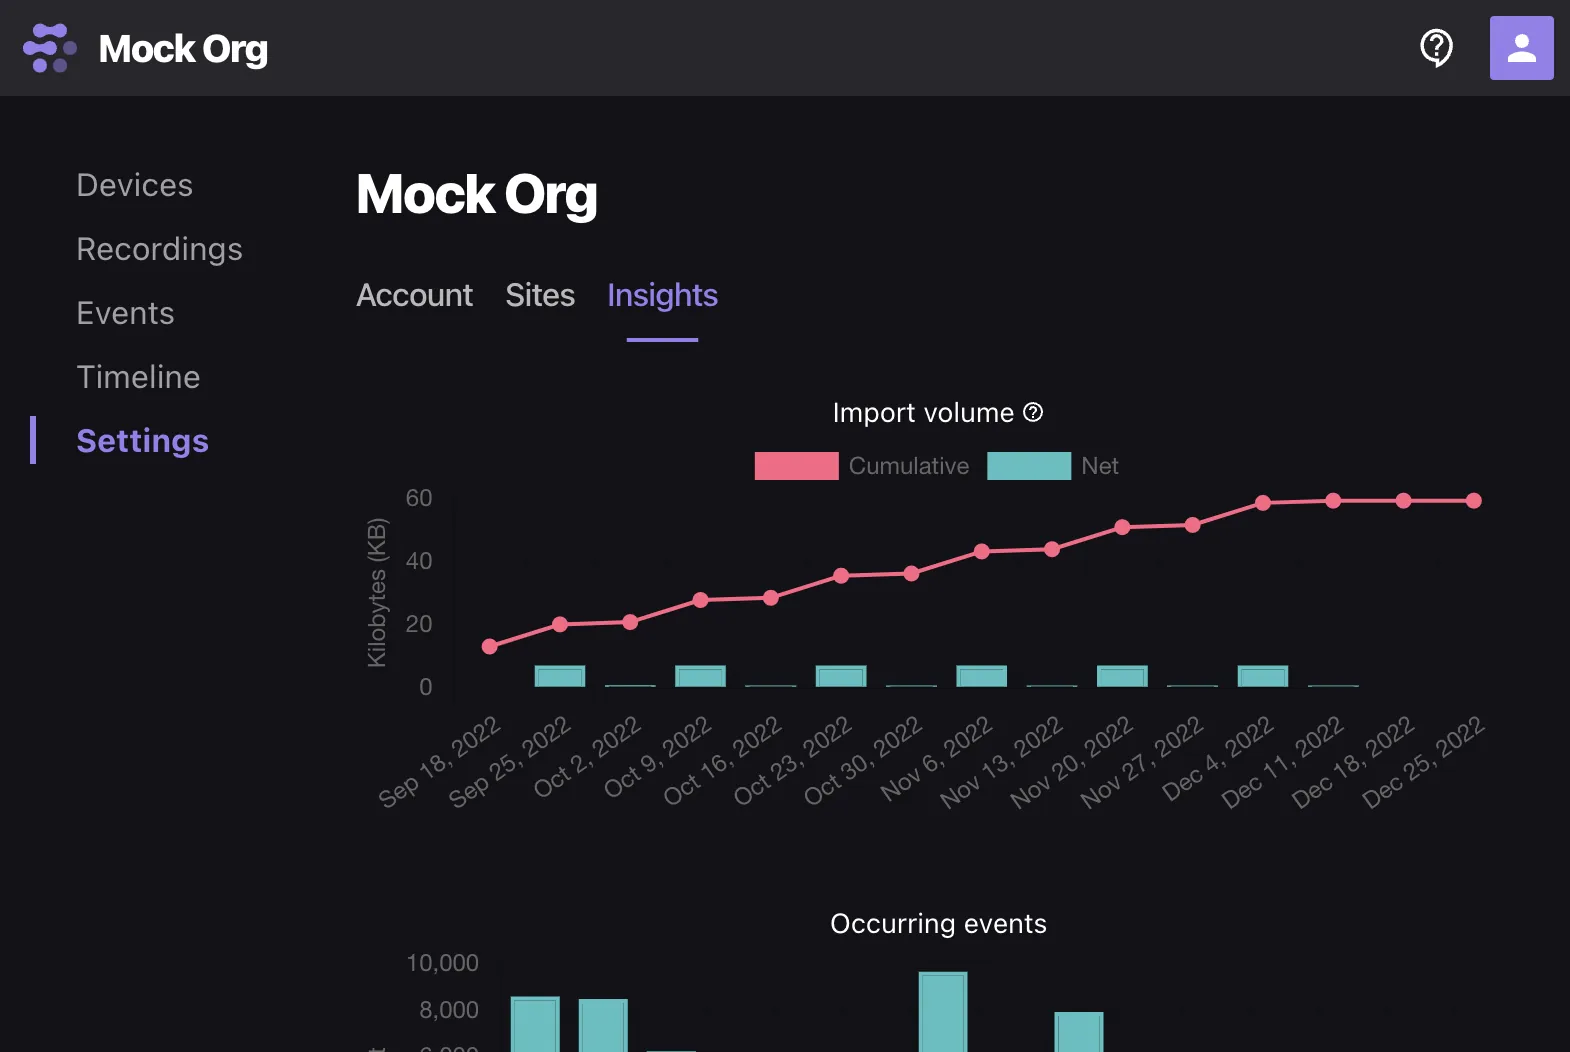
If you’re using Foxglove Data Platform to store, organize, and annotate robotics data, you may be curious about how exactly your team or company is leveraging the tool. How much data is being collected, and how is it being interpreted by your teammates?
To help you answer these questions, we’ve added an Insights dashboard to Foxglove Data Platform. In addition to helping you understand trends in your organization's data usage, we hope that this dashboard will also help you explore new ways to take full advantage of Foxglove features, optimize your development workflows, and reach your team's full potential.
Viewing organization insights
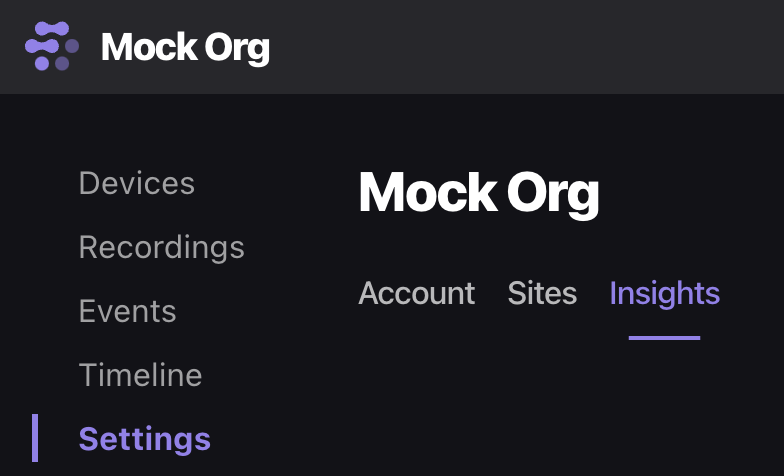
The Insights feature is only available to Foxglove organization administrators. Once logged in to your Foxglove account, navigate to your Settings page and select the Insights tab:
On this page, you’ll see two charts – for Import volume and Occurring events.
Import volume
This chart tracks the amount of data (net and cumulative) your Foxglove organization members have imported, by week:
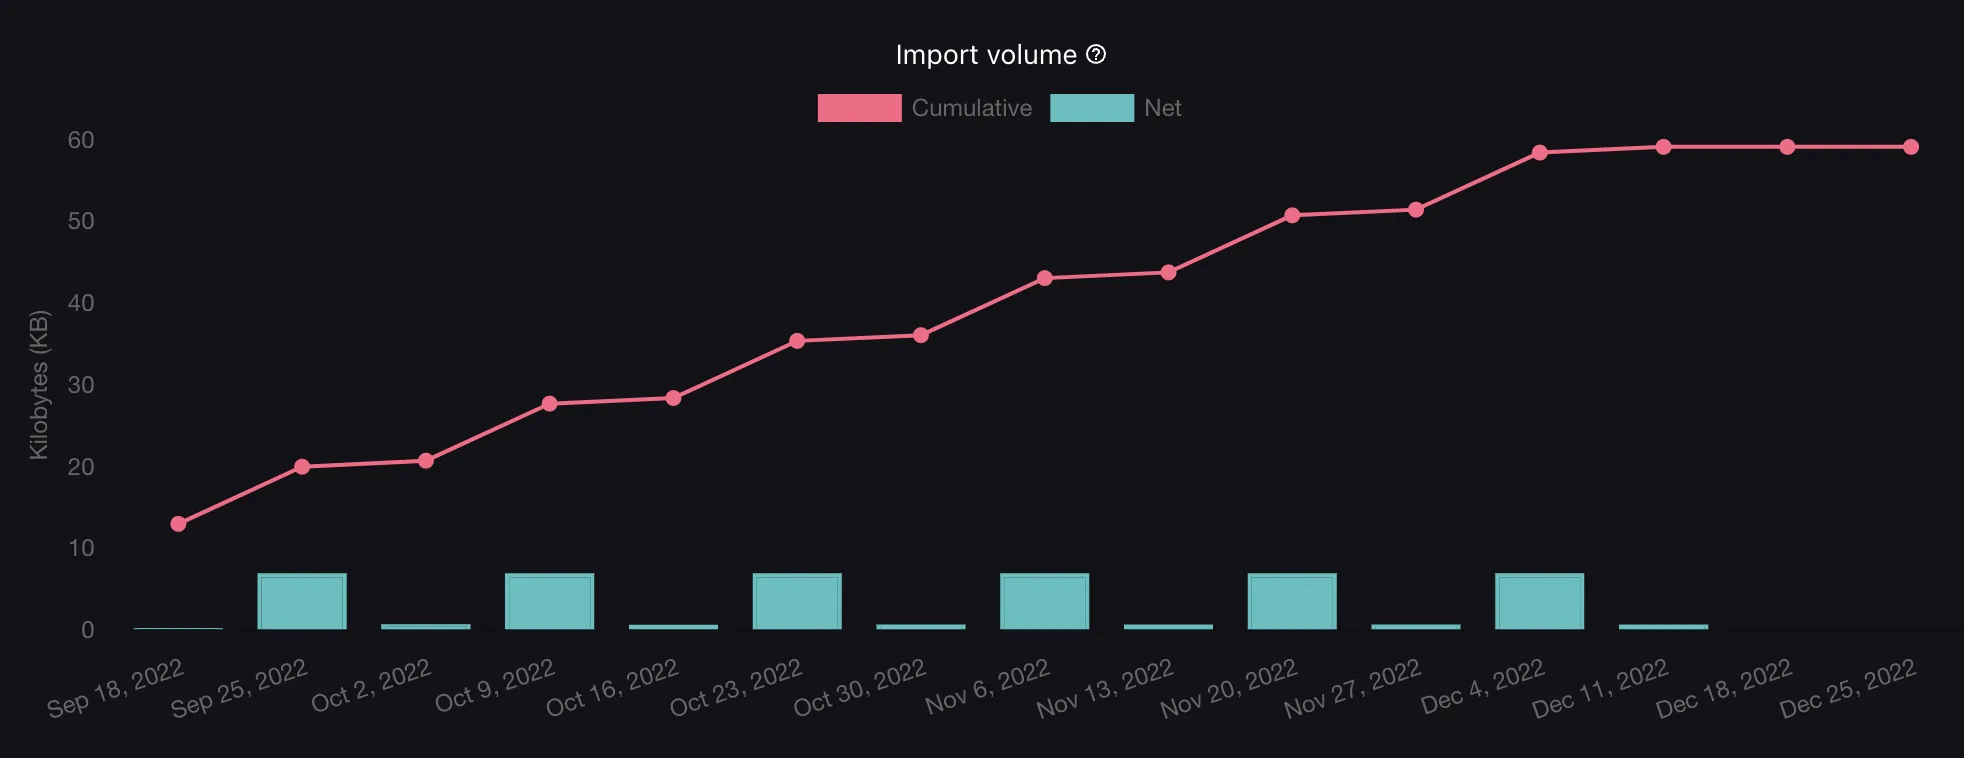
Tracking your import volume can give you a sense of the data storage your company will be billed for, whether you are nearing your plan’s data limit, and the periods of time when your team imported the most data.
Occurring events
This chart tracks the number of events added for a given week of collected data, by week:
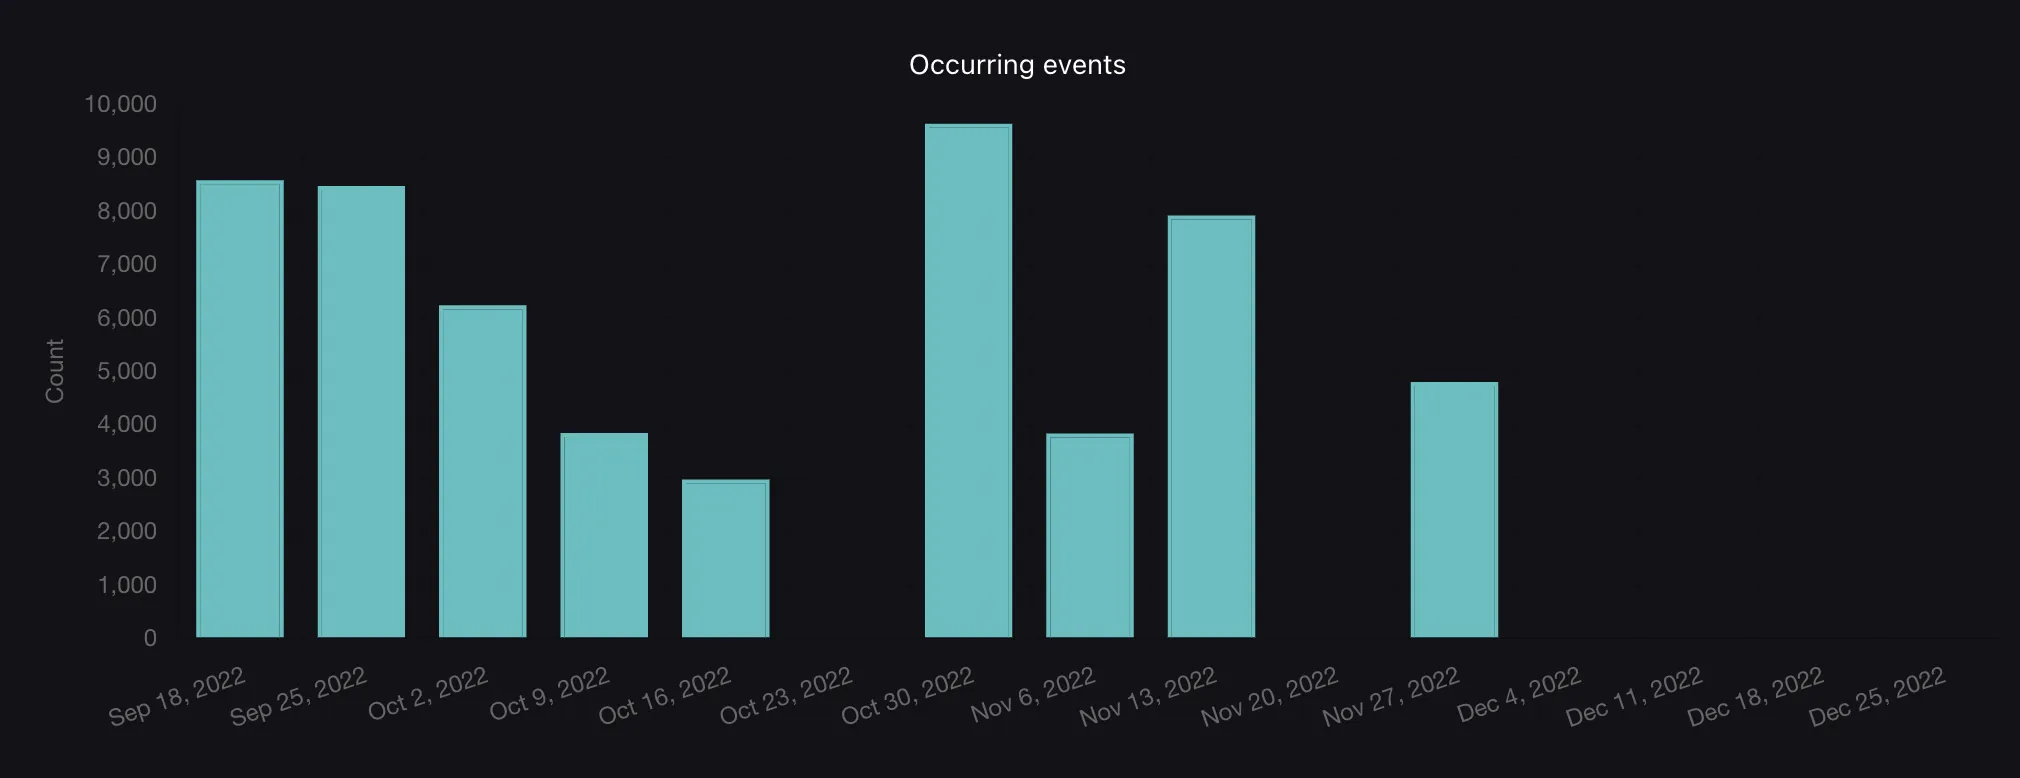
Understanding which date ranges that team members has annotated the most can give you a general sense of your data coverage. Seeing how frequently team members are creating events can also help you understand whether the organization is taking full advantage of this powerful strategy for tagging and exploring data.
Learn more
By understanding how your team is processing and organizing data, we hope you can make better decisions about how to optimize these workflows for continuous improvement. In short, we hope this new Insights dashboard serves as another tool in your robotics development toolbox.
This version of the dashboard is just the beginning. We plan to add more visualizations to help you quickly understand how your team is using Foxglove. If you have suggestions for new features, we’d love to hear them! You can contact us directly, or join our Slack community to share your feedback.
Read more:

Investing in his audacious vision for a robot-powered world
Esther WeonEsther Weon
Record ROS 2 data in more performant and configurable bag file format
 James SmithJames SmithEsther WeonEsther Weon
Get blog posts sent directly to your inbox.