Announcing Foxglove's Improved Plot Settings Interface
Create customizable plots to better understand your robotics data
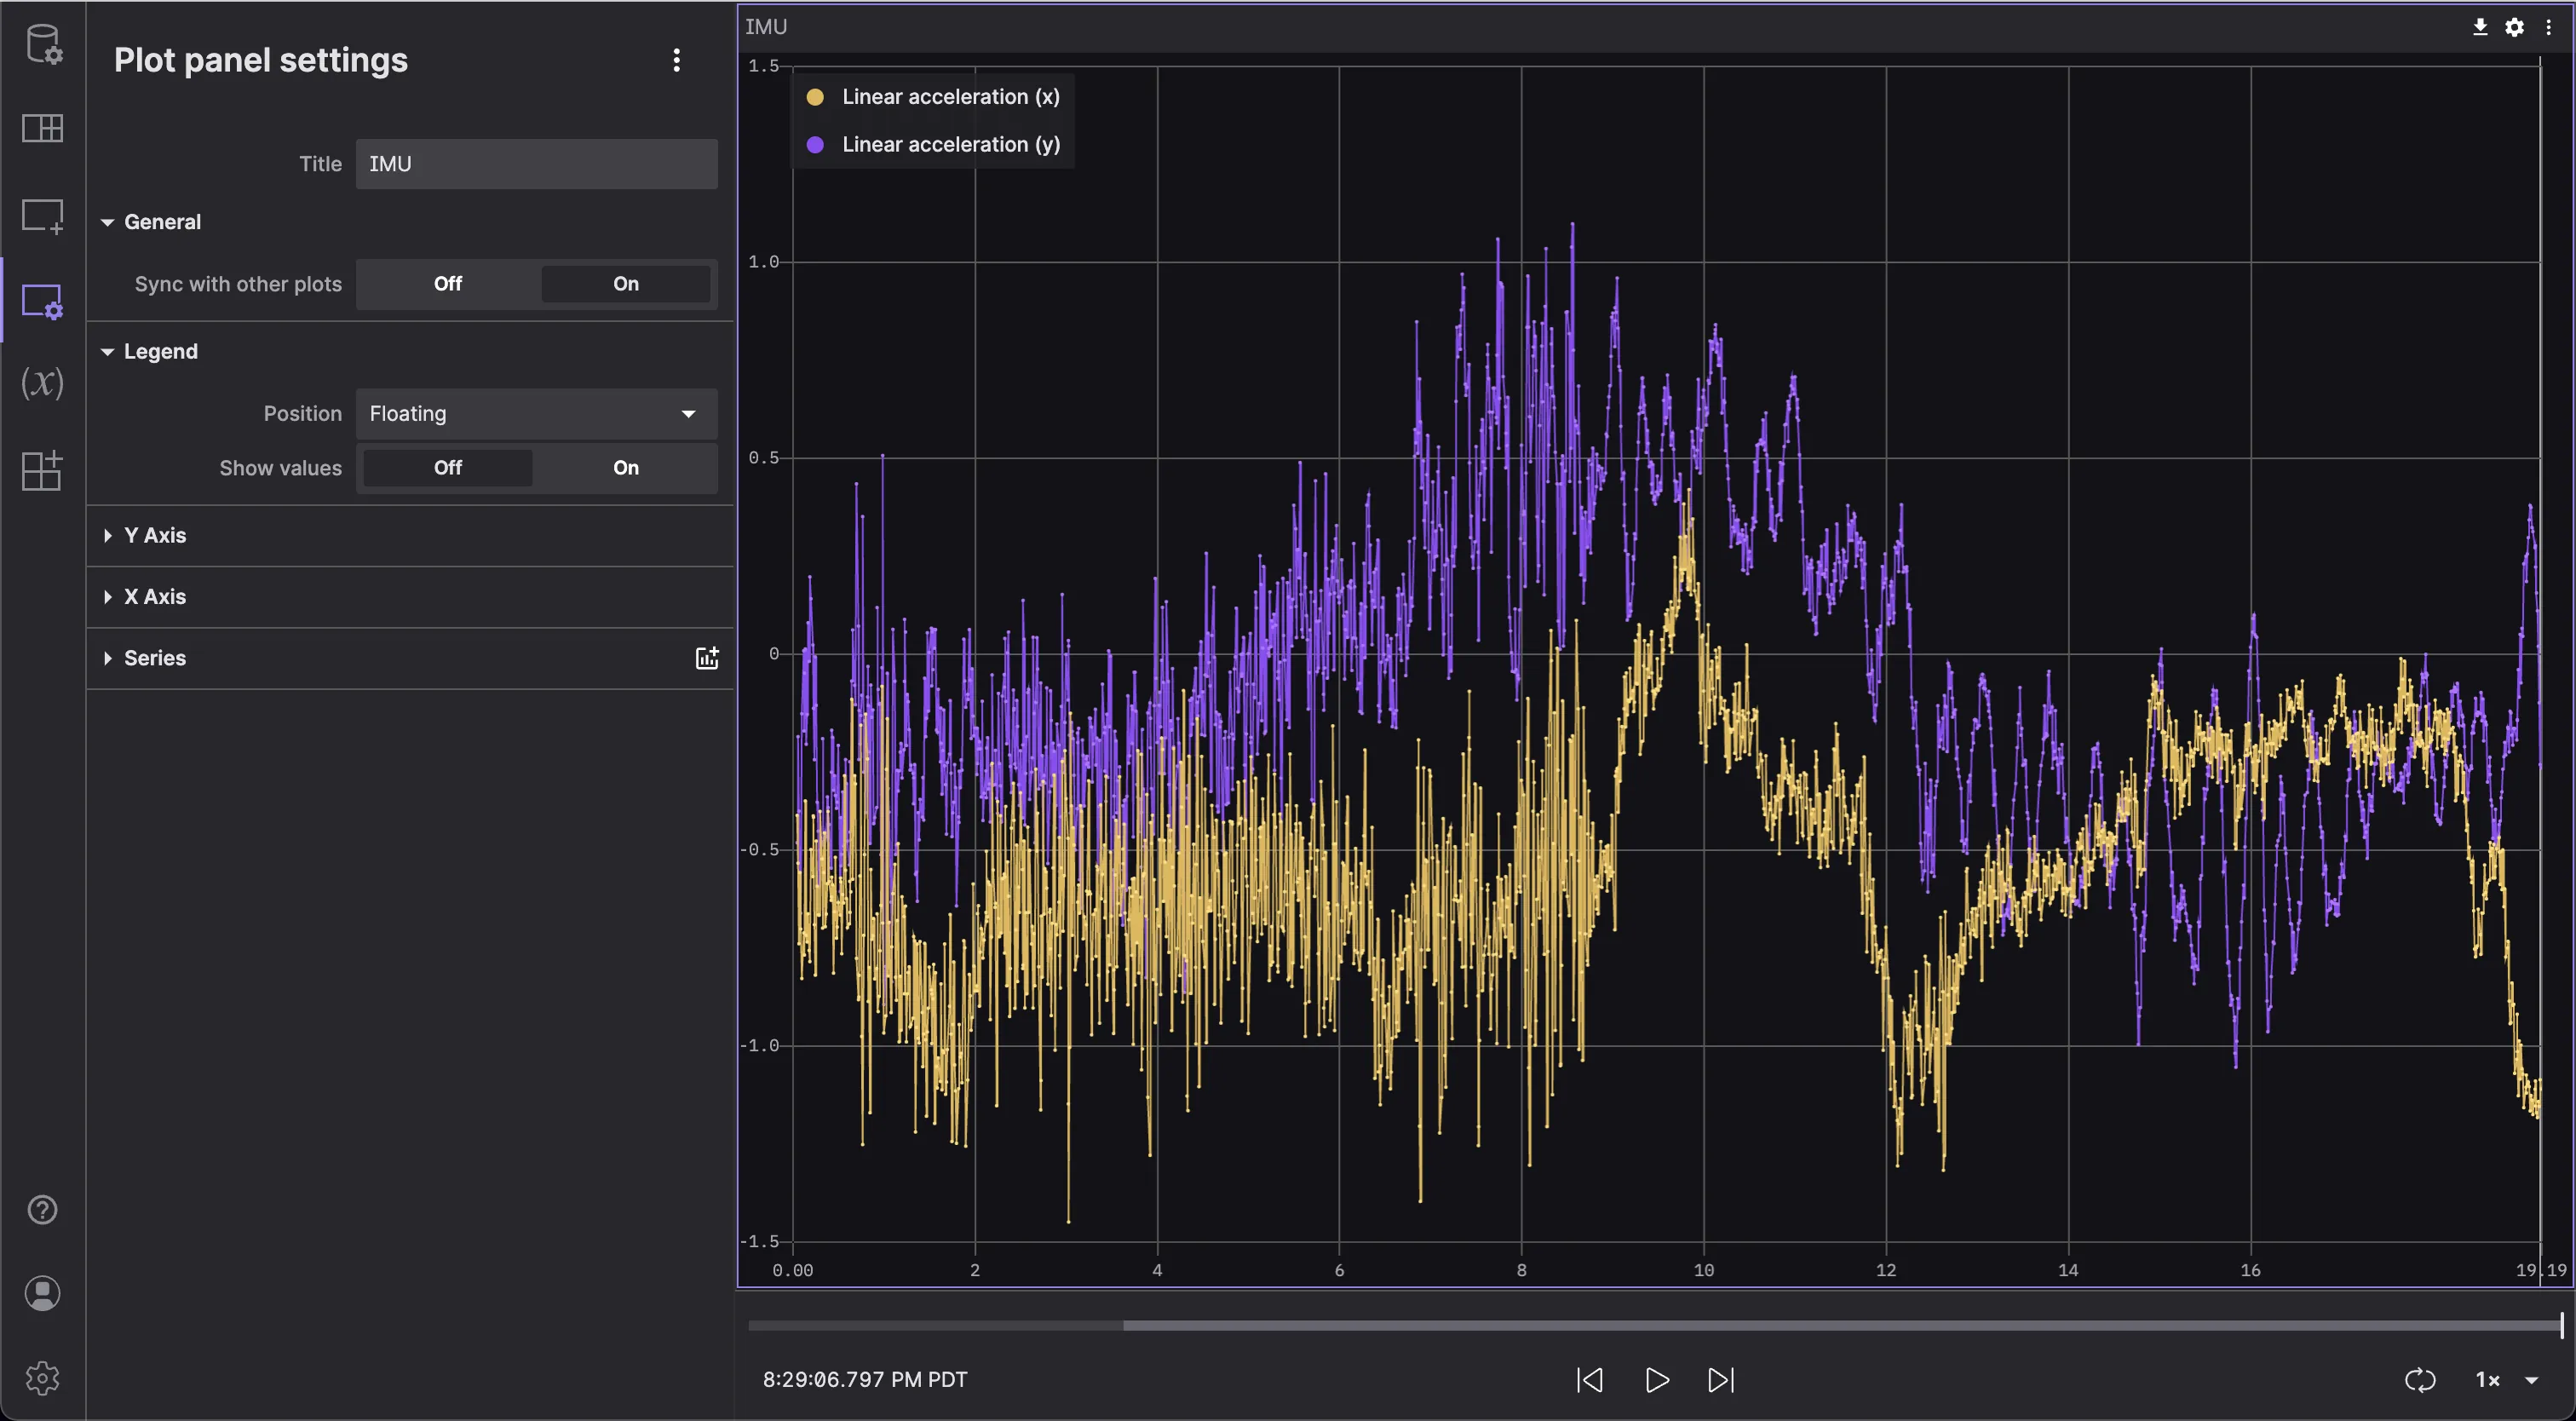

With Foxglove v1.40, you can now customize your plots with the Plot panel’s new and improved settings interface. In addition to offering more configuration options, the new Plot interface consolidates all settings in the app sidebar for a streamlined interface and intuitive user experience.
What’s changed
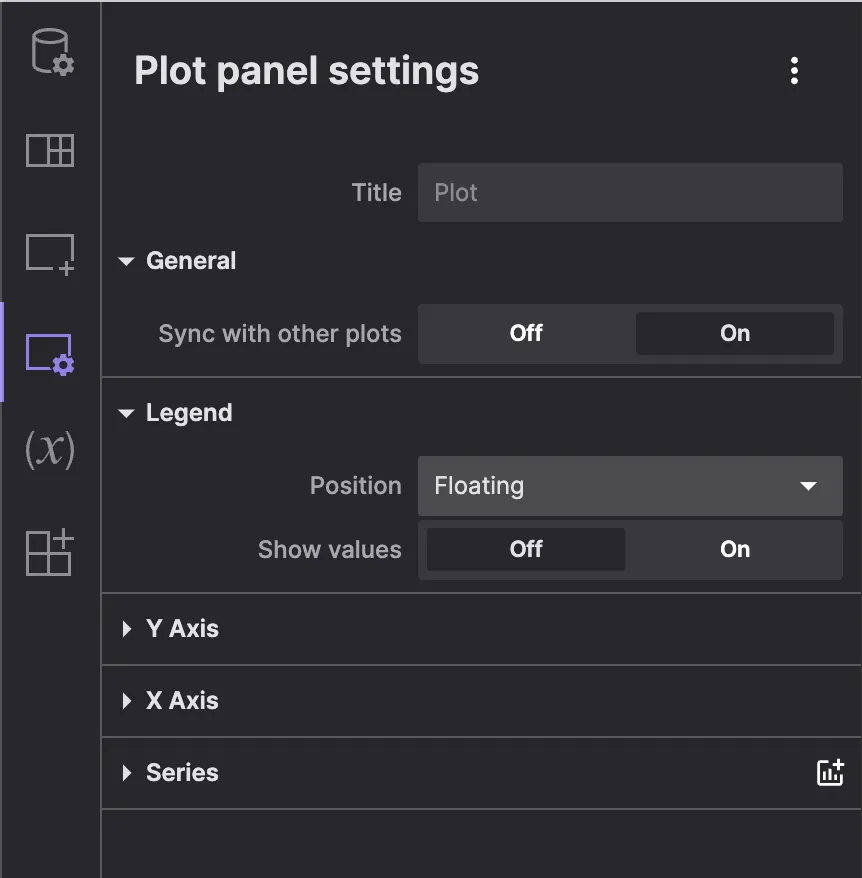
The panel settings interface now contains all the controls you need to customize your Plot panel in one place:
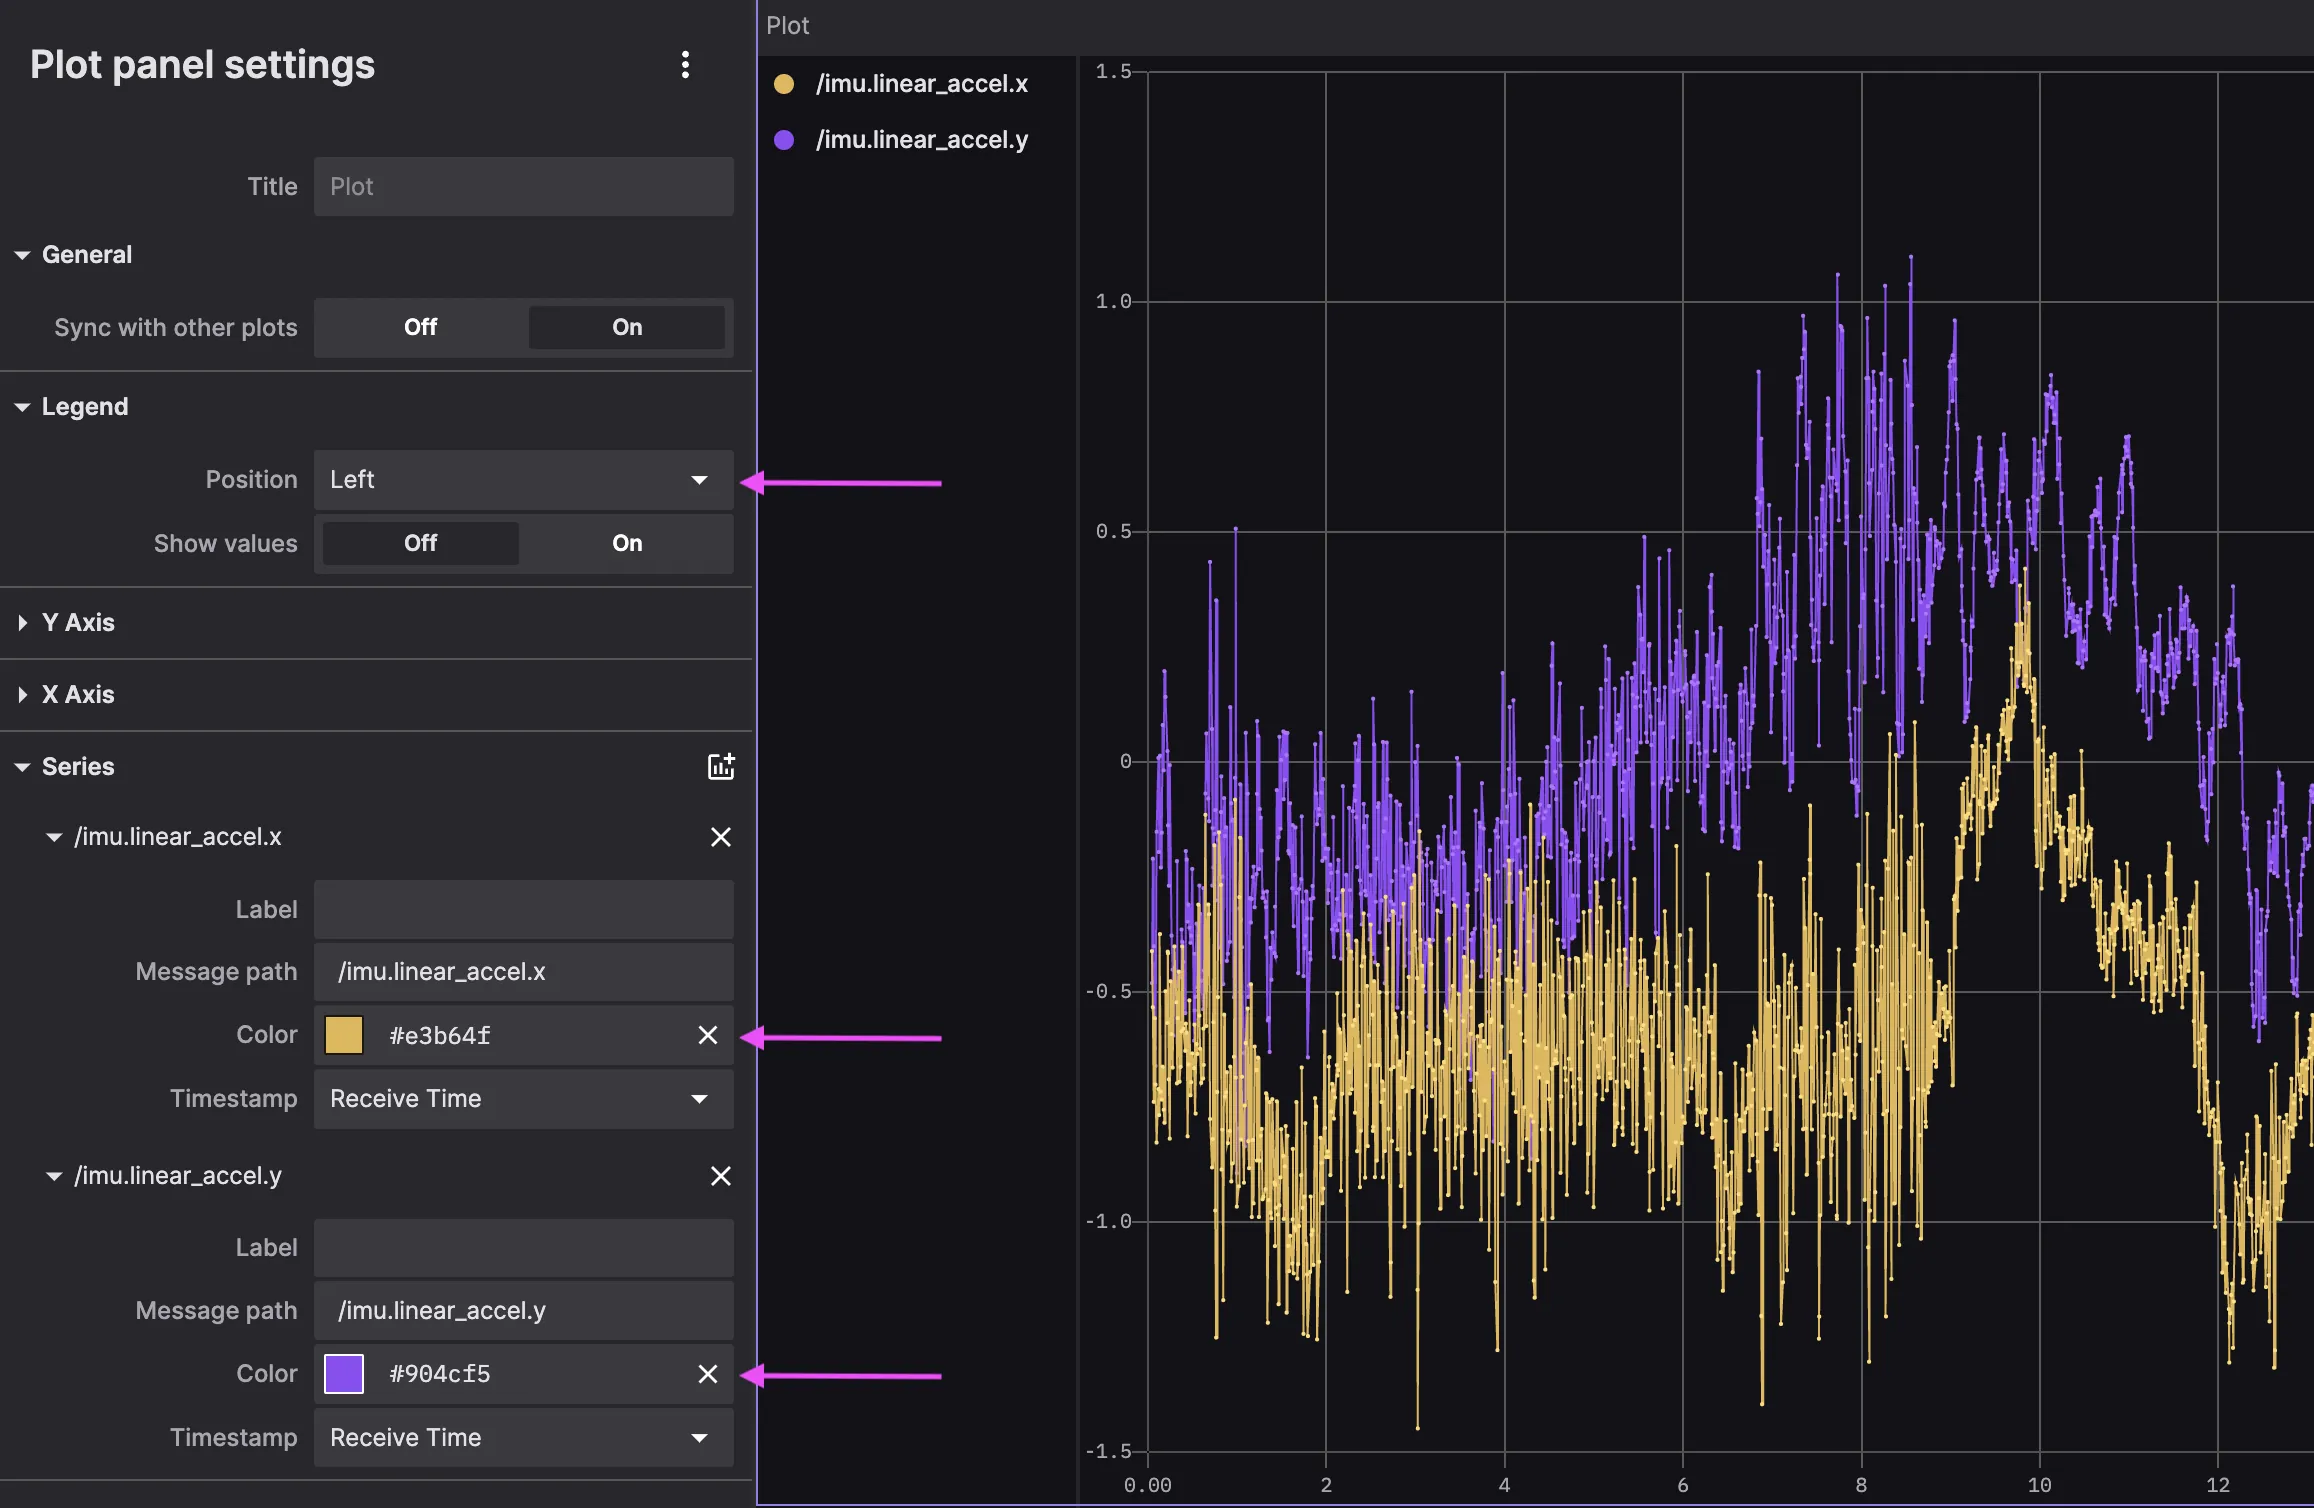
As with the old Plot panel, you can use these settings to adjust your legend position, select your dataseries paths, and customize plot colors:
We’ve also added the long-awaited feature of naming your plots, to better differentiate them from others in your layout:
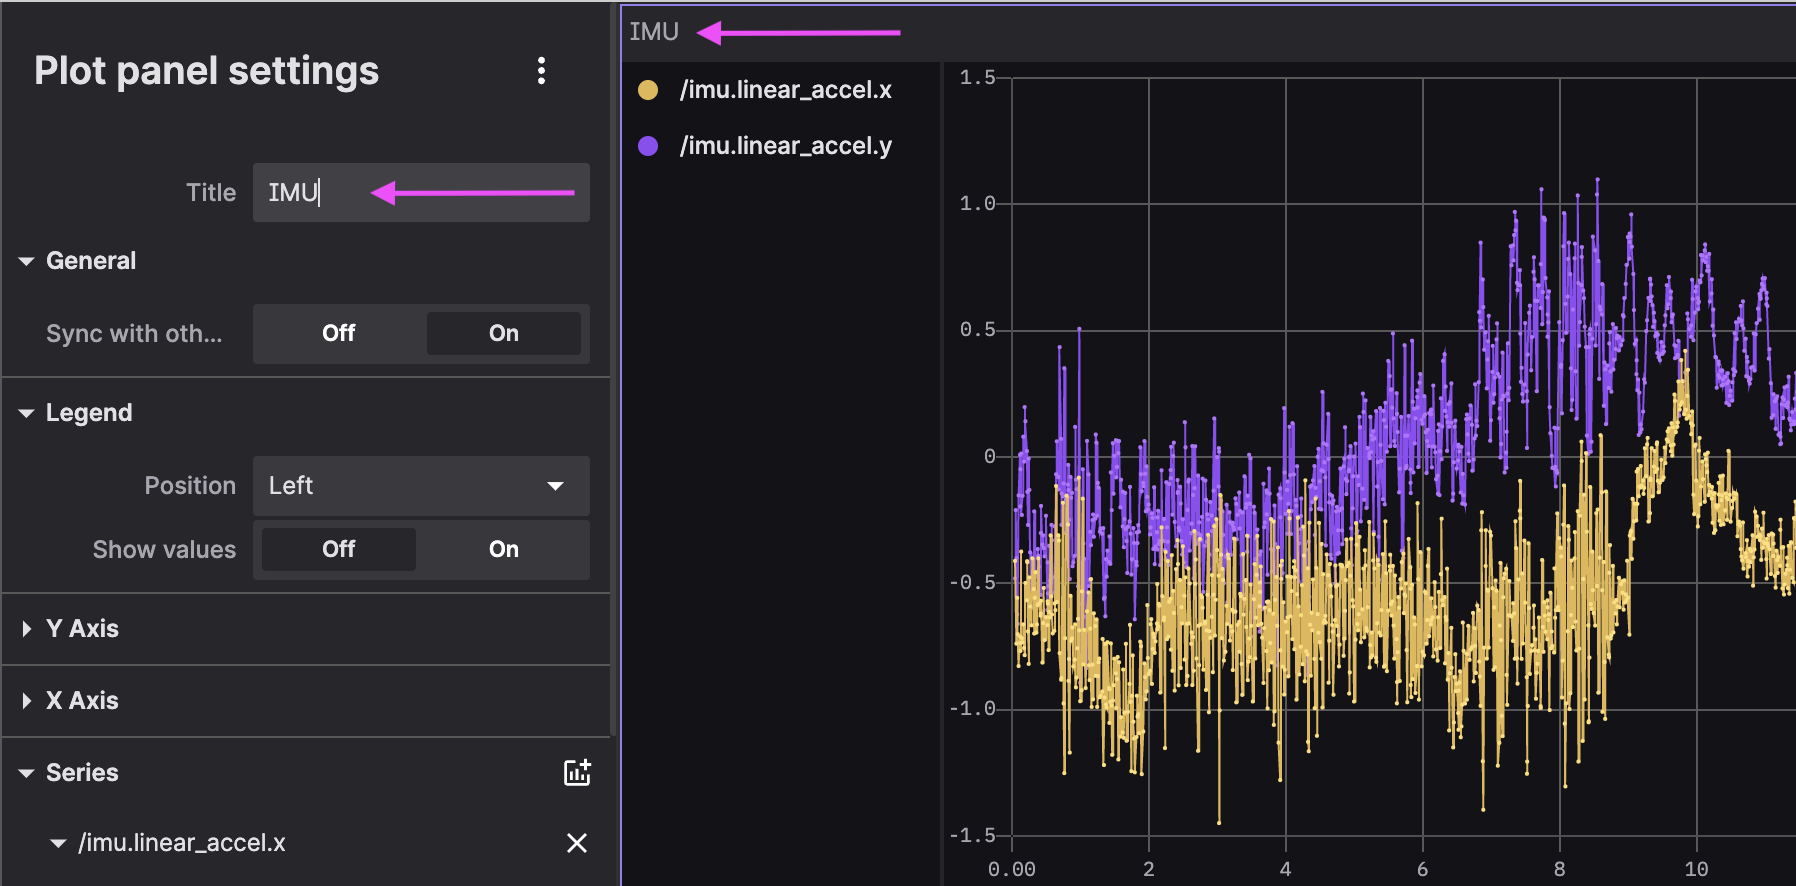
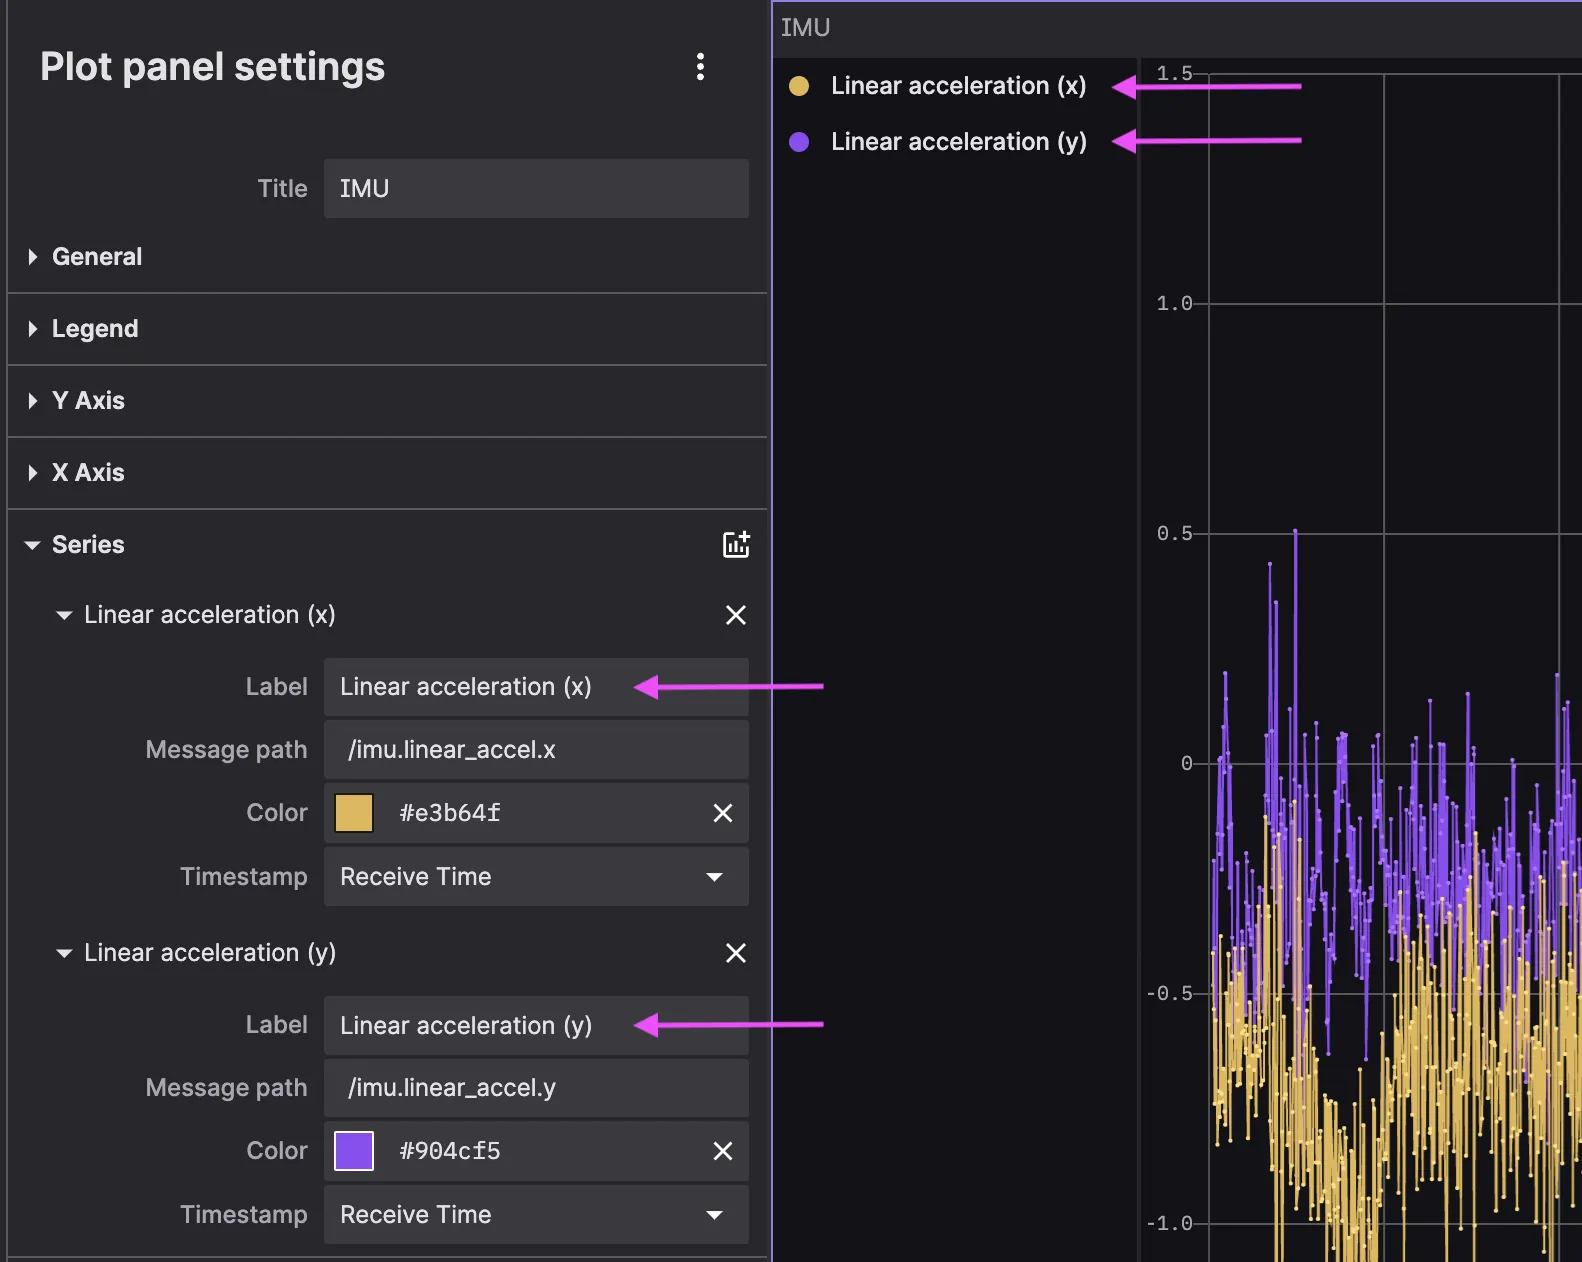
You can also give each data series a human-readable name, to better understand your data at-a-glance:
All these improvements have been made with one goal in mind – to empower Foxglove users to better interpret and analyze their data.
Keep in touch
With this new and improved panel, we hope to make it easier than ever for Foxglove users to build the tools they need to understand their robots. With these redesigned settings and streamlined plotting interface, we hope you can spend more of your development time leveraging our features and diving deeper into your data.
To learn more about our new Plot panel, check out the Foxglove docs. As always, feel free to join our Discord community to ask questions or give us feedback.


