Jupyter Notebooks integration.
Visualize your robotics data directly in Notebooks.


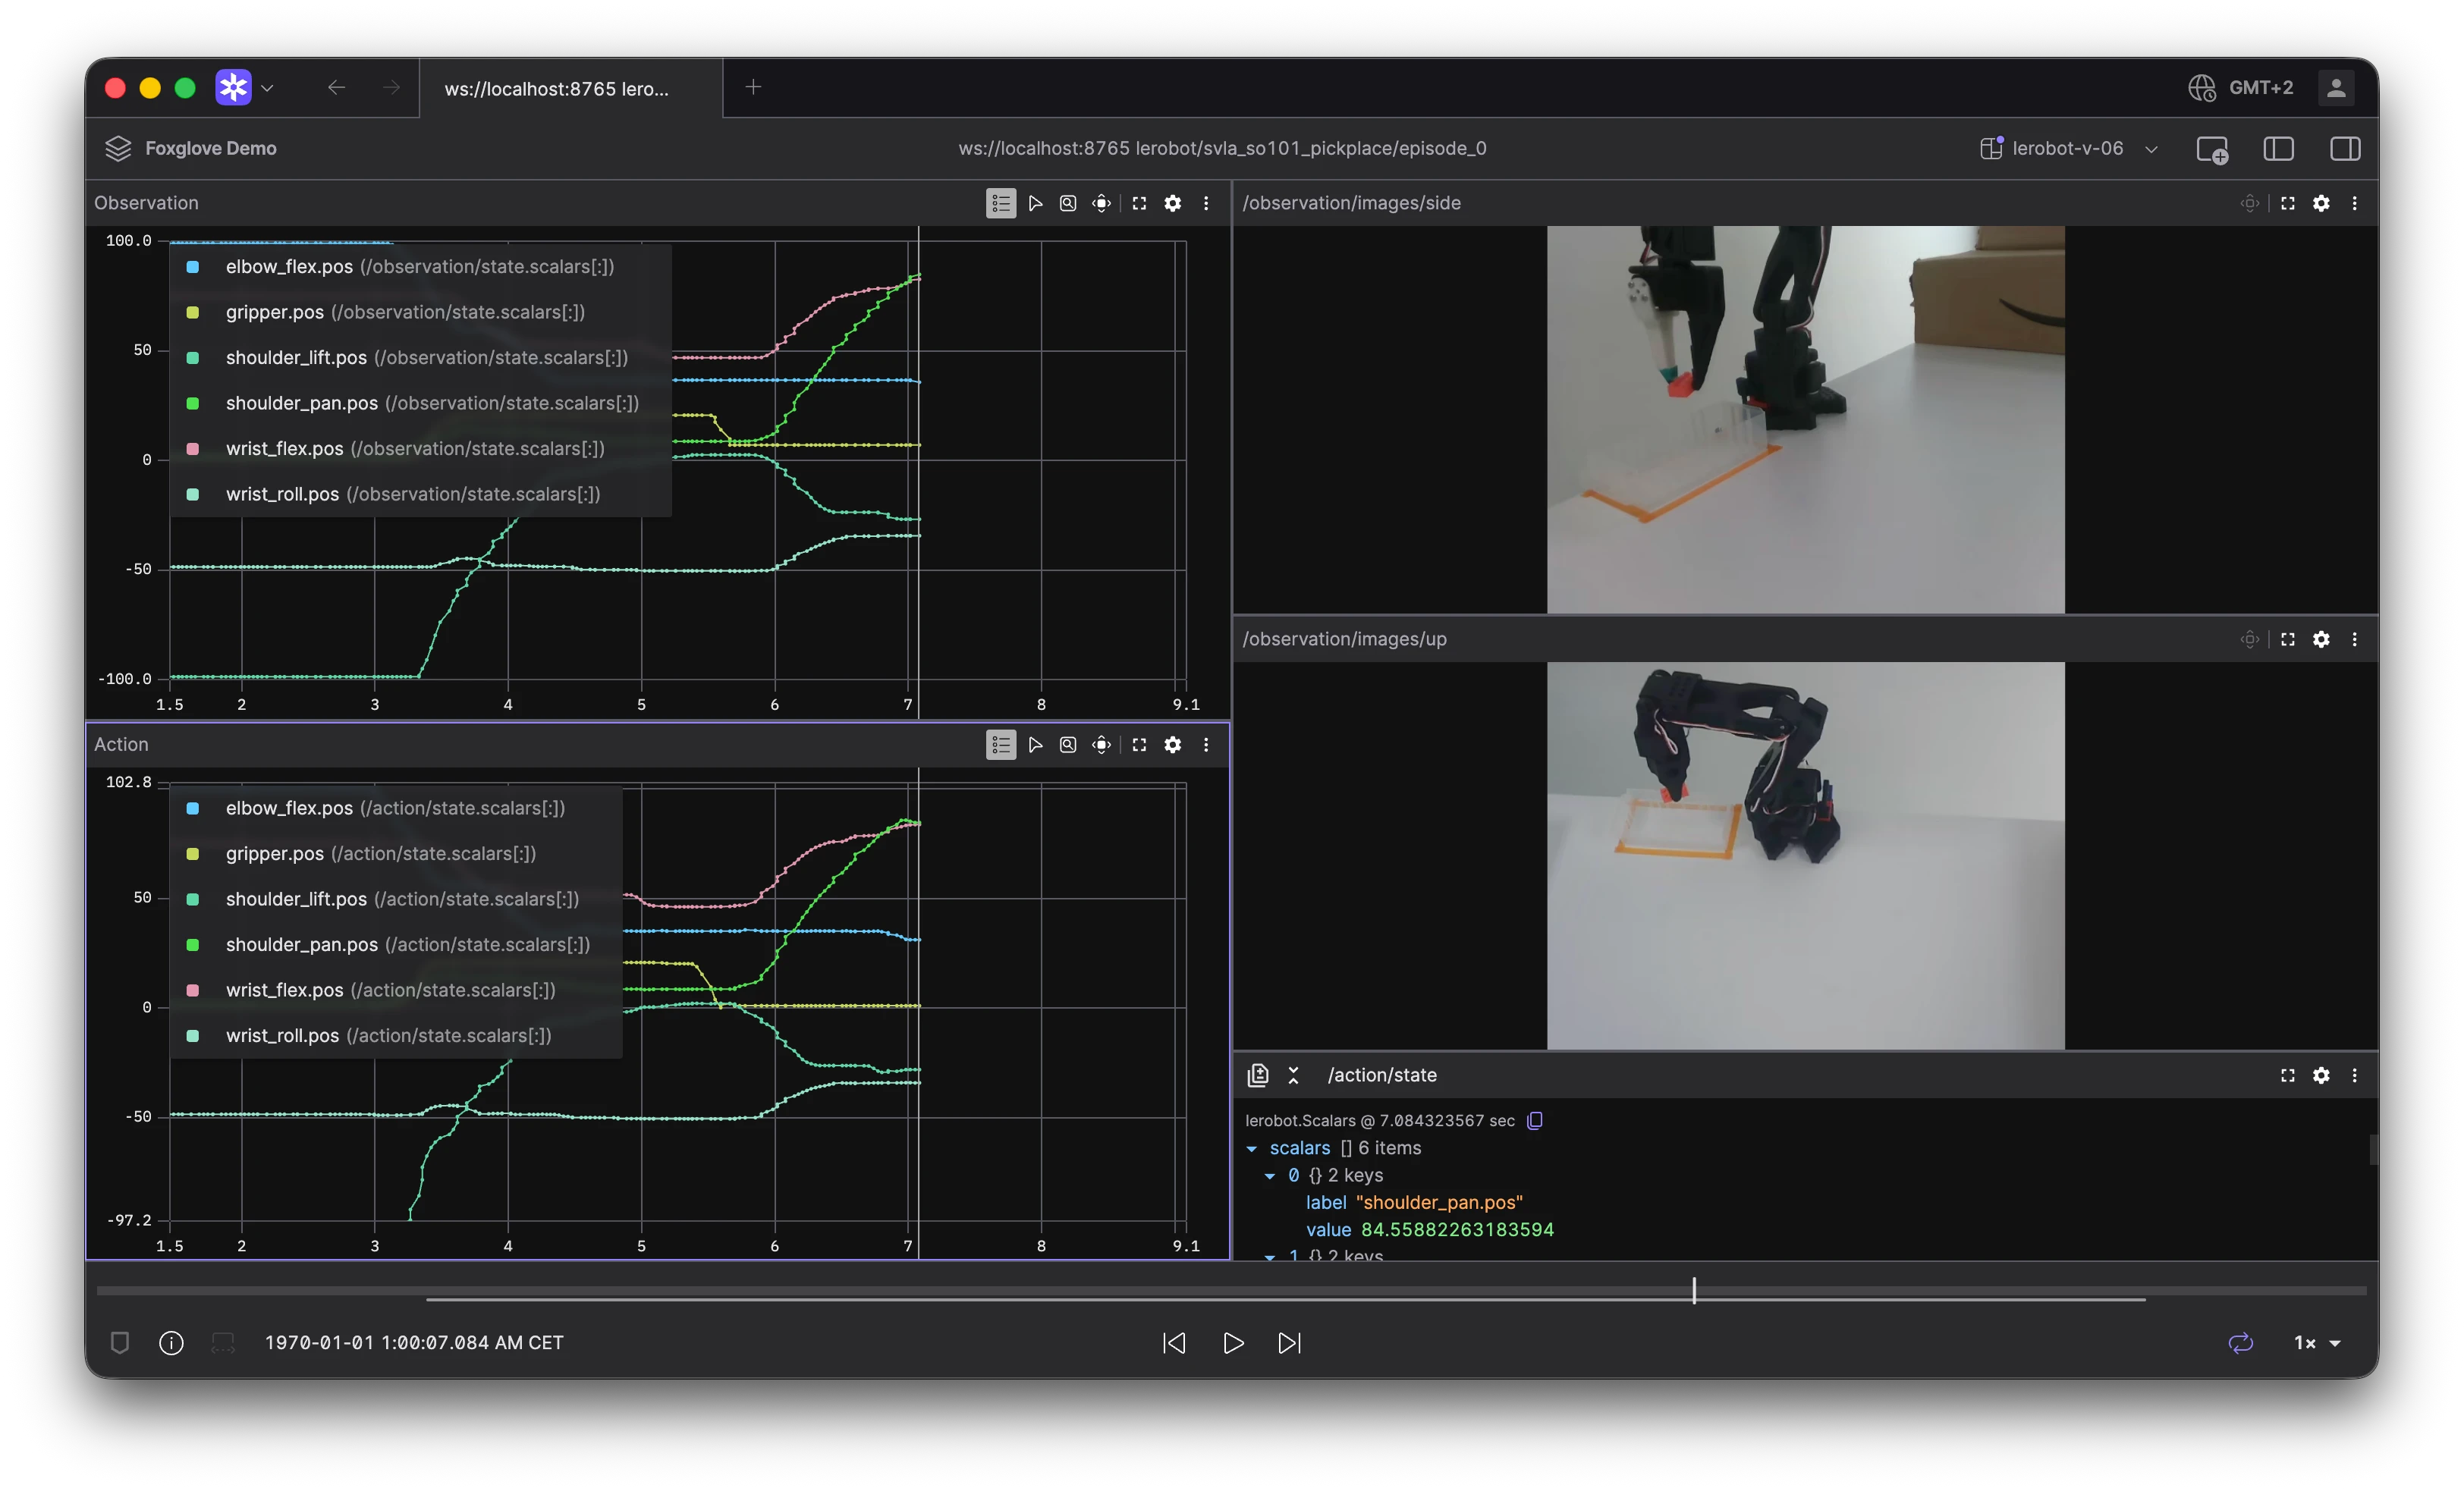
The Foxglove x Jupyter integration enables you to embed Foxglove directly into Jupyter Notebooks, JupyterLab, Google Colab, and even VS Code. When you’re analyzing logged data, the Foxglove SDK offers a widget that gives you full access to Foxglove’s visualization without ever leaving your notebook.
No more launching a separate app or opening a separate tab. Just import the package, log your messages, and inspect your data using your preferred layout.
The Foxglove UI and data integrated with Jupyter Notebooks
Why we built this.
Experimentation often lives inside a notebook, especially in robotics and ML workflows. But until now, visualizing real-world robotics data inside one has been a clunky process. You either saved to disk and opened Foxglove separately, or you reached for simpler tools that don’t support robotics-native formats and schemas.
We wanted to remove that friction. Using the Foxglove SDK, you can now pass data directly from your notebook kernel to a Foxglove viewer running inside the notebook UI. It works with the same layouts you already use in the full app, supporting buffered data. Under the hood, it’s powered by Anywidget, making it portable across notebook environments.
Visualizing buffered data.
Import and use the FoxgloveViewer widget alongside the data streaming APIs from the Foxglove SDK. Log messages in memory and send them in one go.
Example
import math
import json
import foxglove
from foxglove.layouts import *
from foxglove.channels import SceneUpdateChannel
from foxglove.schemas import (
Color,
CubePrimitive,
SceneEntity,
SceneUpdate,
Vector3,
)
scene_channel = SceneUpdateChannel("/scene")
# Create a notebook buffer to collect messages
nb_buffer = foxglove.init_notebook_buffer()
for t in range(10*30):
timestamp = t * 0.033
size = abs(math.sin(timestamp)) + 1
scene_channel.log(
SceneUpdate(
entities=[
SceneEntity(
cubes=[
CubePrimitive(
size=Vector3(x=size, y=size, z=size),
color=Color(r=1.0, g=1.0, b=0, a=1.0),
)
],
),
]
),
log_time=int(timestamp*1e9)
)
# Display the data in a Foxglove viewer.
# This needs to be the last expression in the cell for the widget to be displayed.
nb_buffer.show(layout=Layout(
content=ThreeDeePanel(
config=ThreeDeeConfig(
layers={
"grid": BaseRendererGridLayerSettings(),
},
topics={
"/scene": BaseRendererSceneUpdateTopicSettings(visible=True)
}
)
)
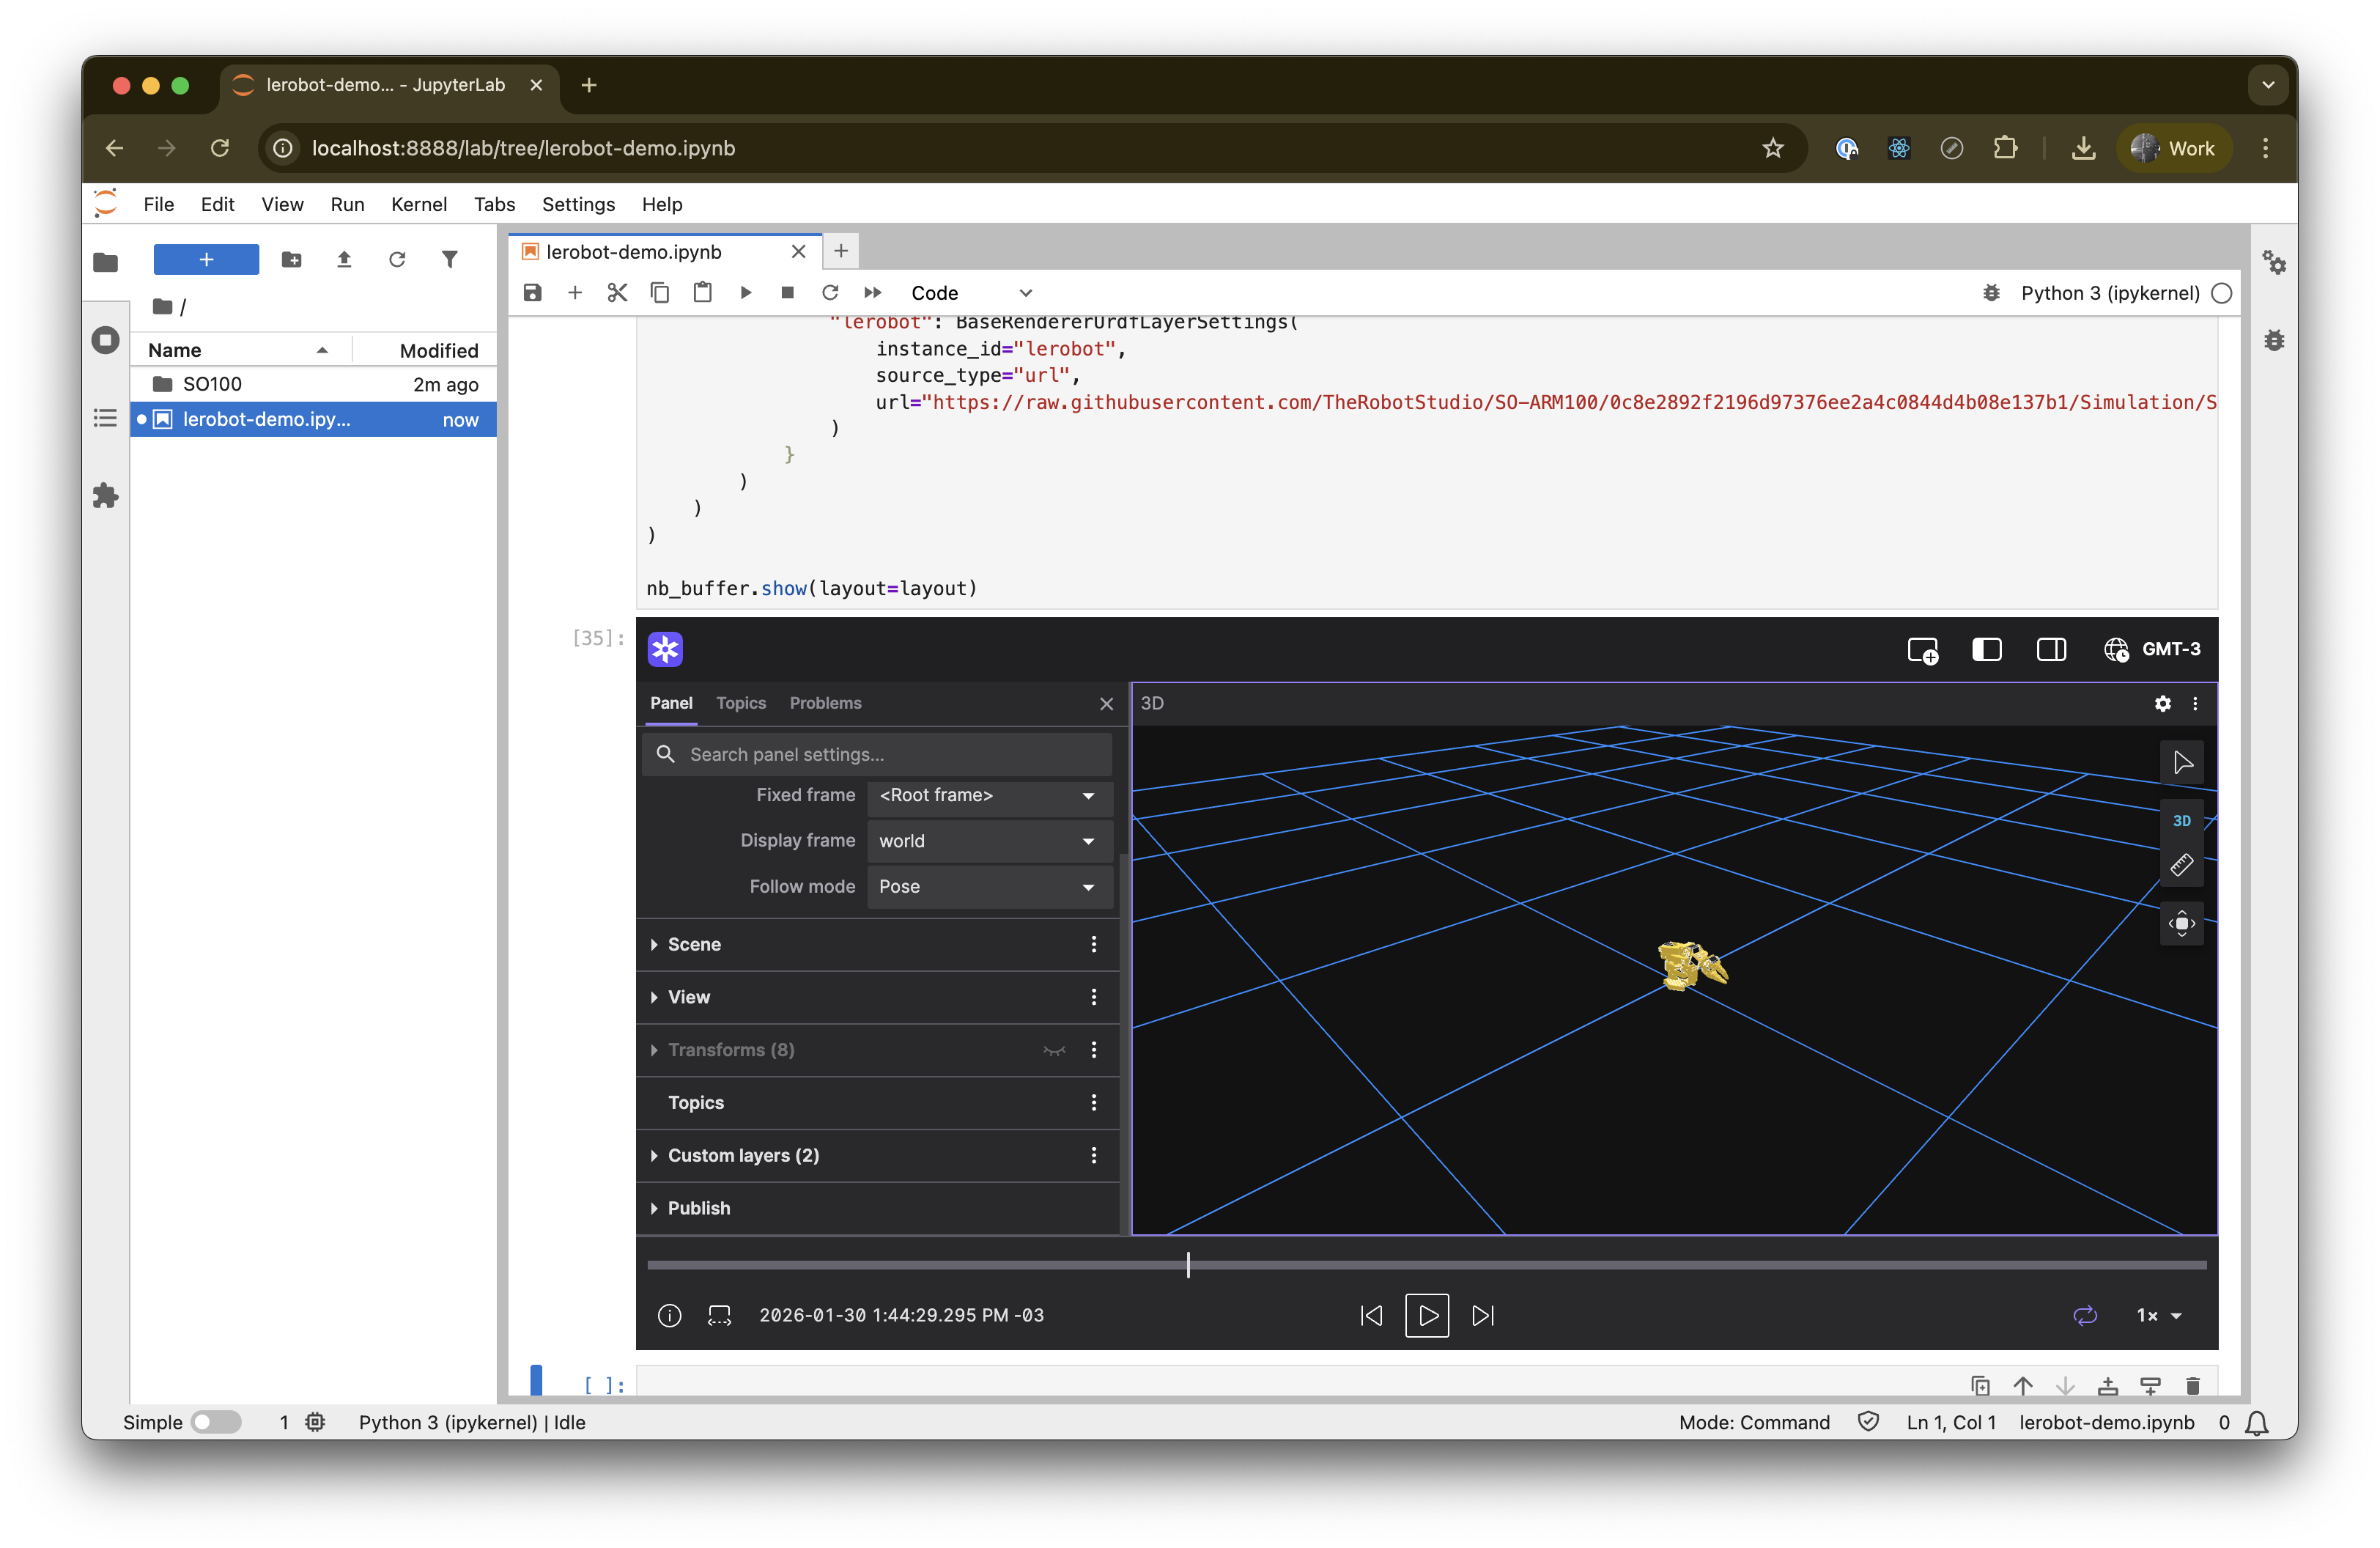
))How it works.
We built this on top of Anywidget, which abstracts over the complexity of syncing Python and frontend state across environments. By leveraging our Python SDK, this gives you a live Foxglove instance running inside the notebook which is capable of rendering dynamic 3D scenes, timeseries plots, images, and any custom schema you define.
There’s no MCAP export step, no local file management, and no server process to spin up.
Foxglove is the most comprehensive and performant visualization tool for Physical AI. With this new integration, we’re extending observability even closer to where robotics developers are experimenting.
Contact us today to get a demo or try it out for yourself.