Improving How Foxglove Loads Data
Optimizing message loading and lookup for accurate data analysis
One of the most powerful features of Foxglove is the ability to pause, seek, and step through your robotics recordings. Anyone that’s had to debug a robot’s behavior from a log file knows how much these capabilities streamline the development cycle and speed up the process of diagnosing complex issues.
But robotics data comes with unique challenges. A typical robotics log file can contain dozens of disparate data streams, all occurring at different rates – this makes it especially challenging to get the data you need when you need it. In response to these challenges, we’ve made some recent changes in Foxglove to improve the experience of pausing, seeking, and stepping through this complex data – whether you’re loading files locally or from Foxglove.
The challenges
Unlike a video file with a single video channel and 2 to 5 audio channels, robot data consists of dozens, if not hundreds, of channels. Each can occur at different rates – you might have sensor data at 10hz or 30hz, odometry data at 50hz or 100hz, and map data at 0.01hz or even slower! Across all this, you may even have a transform system publishing a firehouse of transform data with no defined rate.
Unlocking accurate analysis
Despite these challenges, we want to pause, seek, and step through our data as easily as a video! We’ve made some recent changes in Foxglove to improve this experience – whether you are loading files locally or from Foxglove.
Message lookback
Let’s say you open a local MCAP or ROS bag file that’s 30 minutes long and want to jump to some time 12 minutes into the recording. If Foxglove loaded only the messages at the time you jumped to, there’s a high likelihood that every panel would be blank! Why? It’s unlikely that every topic you are visualizing has a message at exactly the time you jumped to; most will have messages sometime before or sometime after.
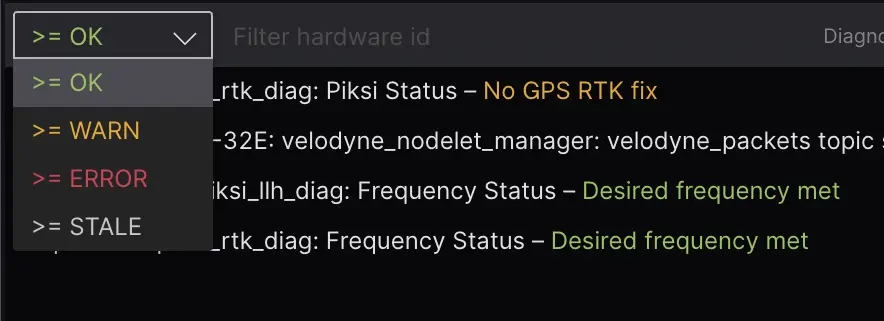
We now perform a “message lookback” on your data, to find the most recent message for each topic you want to visualize. When you seek 12 minutes into the recording, you’ll see the latest 100hz odom message in the Raw Messages panel, the most recent camera image in the Image panel, and an occupancy map in the 3D panel, even if these messages occurred minutes apart. In ROS, this is referred to as “latching”, and must be explicitly enabled on topics that publish infrequently. With message lookback, Foxglove automatically displays all topics as if they were latched.
Using the example dataset below with messages arriving at different times across topics, assume we seek to the red line. To properly display data across each of our visualization panels, we need to load message data from different times within the file.
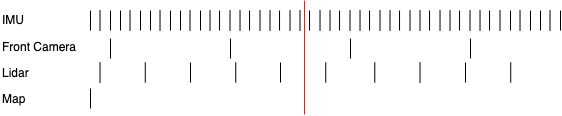
You can see the effect message lookback has on the user experience when seeking. If we only loaded the most recent 0.1 seconds (or even 1 second!), we could omit important visual information that might not occur again in our data.
Before implementing message lookback, Foxglove panels are missing critical information when a user seeks around a data source.
After implementing message lookback, Foxglove panels accurately display all data as soon as a user seeks to a new timestamp.
Faster time to first message
Whether loading data from local files or a remote server, we want Foxglove to feel responsive, and display your message data as soon as it is available. We recently optimized how we load data, to more efficiently display it in visualization panels.
Foxglove has a concept of a “player”, which is responsible for fetching messages from a data source and delivering them to each visualization panel. Originally, Foxglove was designed to load messages from a local or remote data source in batches, with a specific start and end time for each batch. Panels needed to wait until an entire batch finished loading before rendering anything.
Now, we’ve updated the players to handle data preloading and playback separately and with different techniques. This architecture allows us to load message data for playback much more quickly. It also allows us to write adapters for different data sources using a common interface, while still leveraging each data source’s specific properties for loading messages.
More efficient preloading
Most panels in Foxglove display the most recent message on a topic. However, some visualizations benefit from displaying messages across the entire playback time range. The Plot and Map panels are examples of this behavior: a common workflow is opening a plot panel to plot a signal over the entire time range of data — this allows for quickly scanning for anomalies. For a map panel, it allows seeing the GPS location of the robot across the entire time range.
But preloading data in this manner also brings benefits to the 3D panel, even though it primarily visualizes the most recent message on each topic (e.g. the latest point cloud). Complex robots often have many coordinate frames — for example, each joint of a robot arm might be its own frame, or a self-driving car might have a frame for each of its cameras as well as a frame for the street map. To render a single 3D scene containing visual elements from different coordinate frames, the panel needs to figure out how to transform all elements to a single coordinate space. We use a database of transform messages to perform these calculations.
Since transform messages accumulate and update over time, if the database only had the latest message, or was missing transforms between coordinate frames, you might see an incorrect or partially rendered scene. Instead, the 3D panel is now able to preload all the transform messages from the entire time range, to correctly place all elements in the scene even when the user rapidly seeks across time.
Preloading data is powered by the same iterator-based message reading described above, allowing us to re-use message loading patterns, and enabling the preloading layer to handle caching appropriately.
Looking forward
Visualizing data is at the heart of understanding what a robotics system did and why it did it; rarely is there a one-size-fits all solution. At Foxglove we are constantly evolving our products to help roboticists gain insight into their systems in new and powerful ways, and to help bring robots to market faster.
Join our Discord community to ask any questions, or reach out to us directly with any feedback.