Spotlight: Building a Driverless Racecar for Formula Student 2022
Racing to the finish line with Foxglove
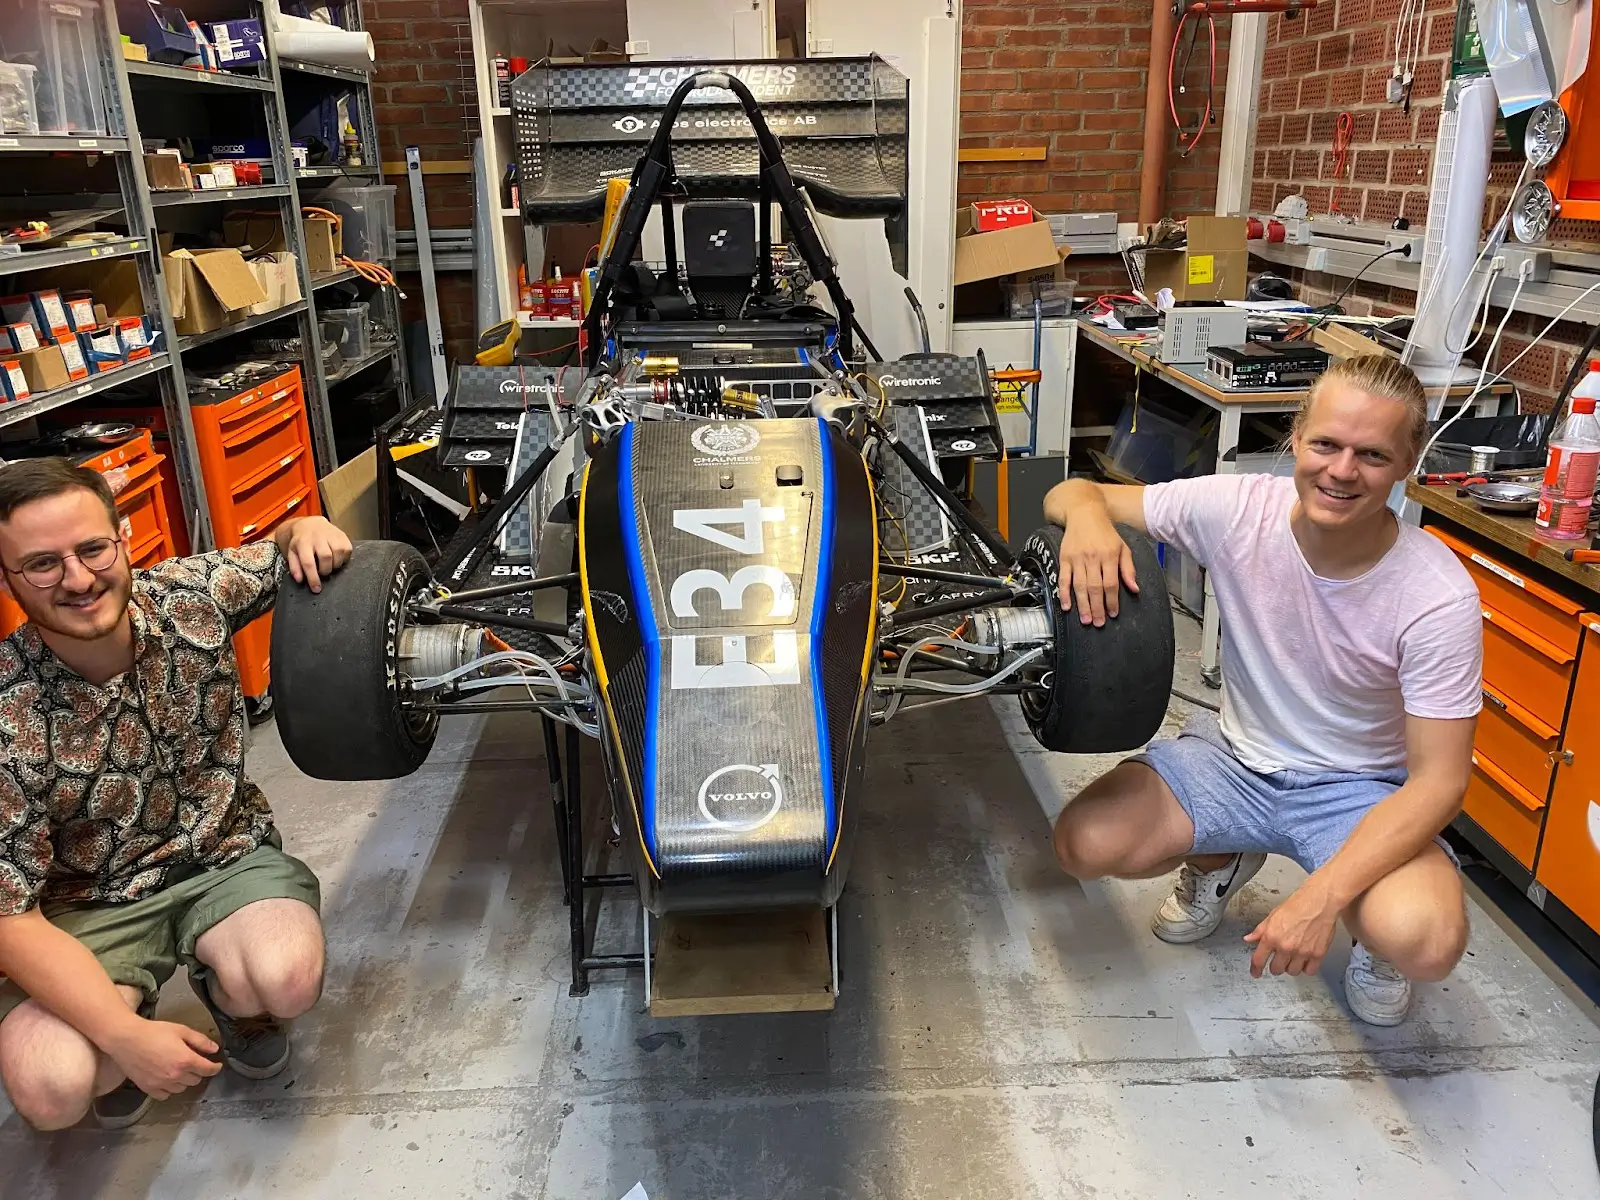
Bernardo Taveira is a racing enthusiast, having spent the past 3 years involved in the Formula Student competition – first in the vehicle dynamics area, and now picking up the new driverless challenge. After finishing his master’s in Systems, Control and Mechatronics, he hopes to pursue a career in the automotive field developing autonomous car software.
Kilian Freitag is a Complex Adaptive System student and a robotics admirer, who previously didn’t have much to do with racing but was working on other types of mobile robots (like those that can follow humans, for instance). He can be found in the mountains when not in front of a screen.
As students at the Chalmers University of Technology in Sweden, we love writing code that interacts with the real world. This passion is what inspired us to participate in our university’s Driverless Formula Student team this year.
Our team’s history
Formula Student is the largest engineering student competition in the world, with over 600 teams from every continent. We’re especially proud to be members of the Chalmers Formula Student team, the oldest Swedish team in the competition with over two decades of experience.
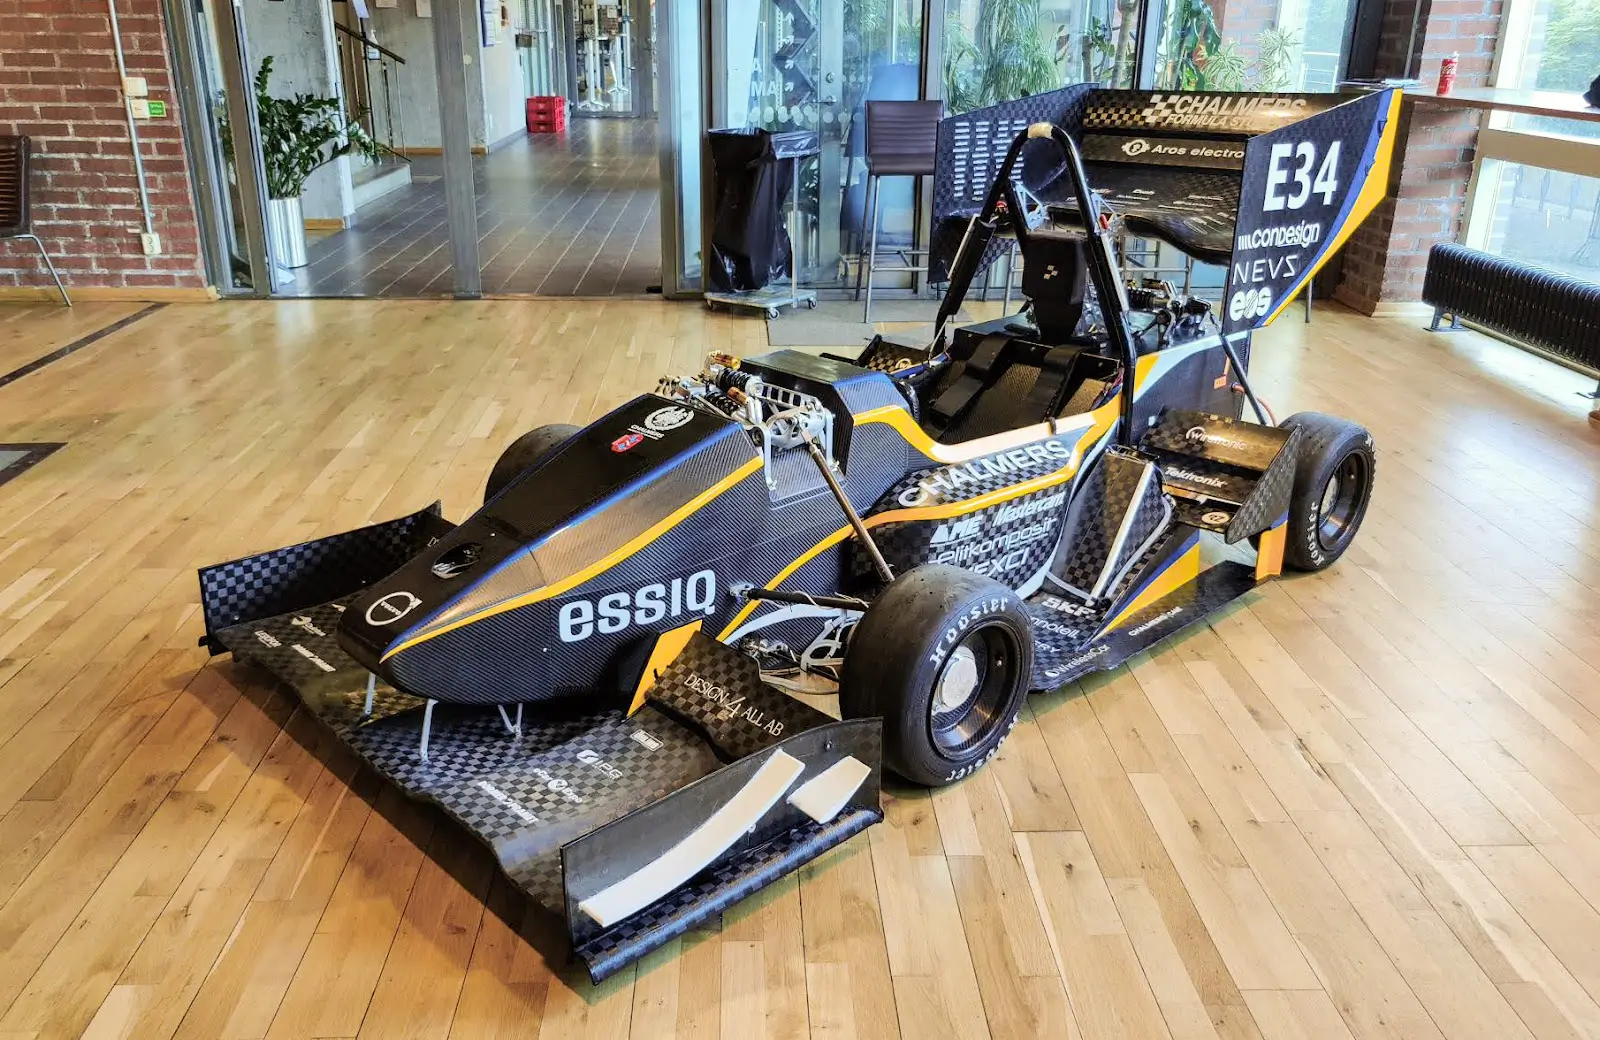
We thrive to design, build, test, and race a better formula-style car every year. For the past 4 years, we have been building electric 4-wheel drive cars fully made of carbon fibre, capable of accelerating from 0 to 100km/h in under 2.5 seconds.
This year we introduced a car named Hilbert, which introduced driverless capabilities for the first time in our team’s history. This momentous milestone opens the door for us to compete in both the driverless and manual-driven classes this summer.
Our goals for the 2022 season
Our team is divided in several subgroups: Frame, Aero, Powertrain, Suspension, Electronics, and Software. Software is further divided into 3 subgroups: Low Level, Control, and Driverless.
As members of the Driverless subgroup, we are responsible for everything from gathering data from the car’s sensor inputs and dealing with telemetry to logging all signals and generating its driving command output. Consequently, we function as one of the highest-level software teams in the whole project.
In previous years, we’ve run into challenges with deploying updated code to the car and debugging data live. We’d also encountered challenges with monitoring signals without a wireless connection, as well as reusing and building on programs written by previous teams. Adding driverless capabilities meant that we would be dealing with even more signals, and keeping track of even more potential points of failure.
With all this in mind, we decided to make robustness a core focus for this year. We wanted to establish a baseline software stack for a driverless car that would be easy to analyse and improve upon in the coming years.
Our tech stack
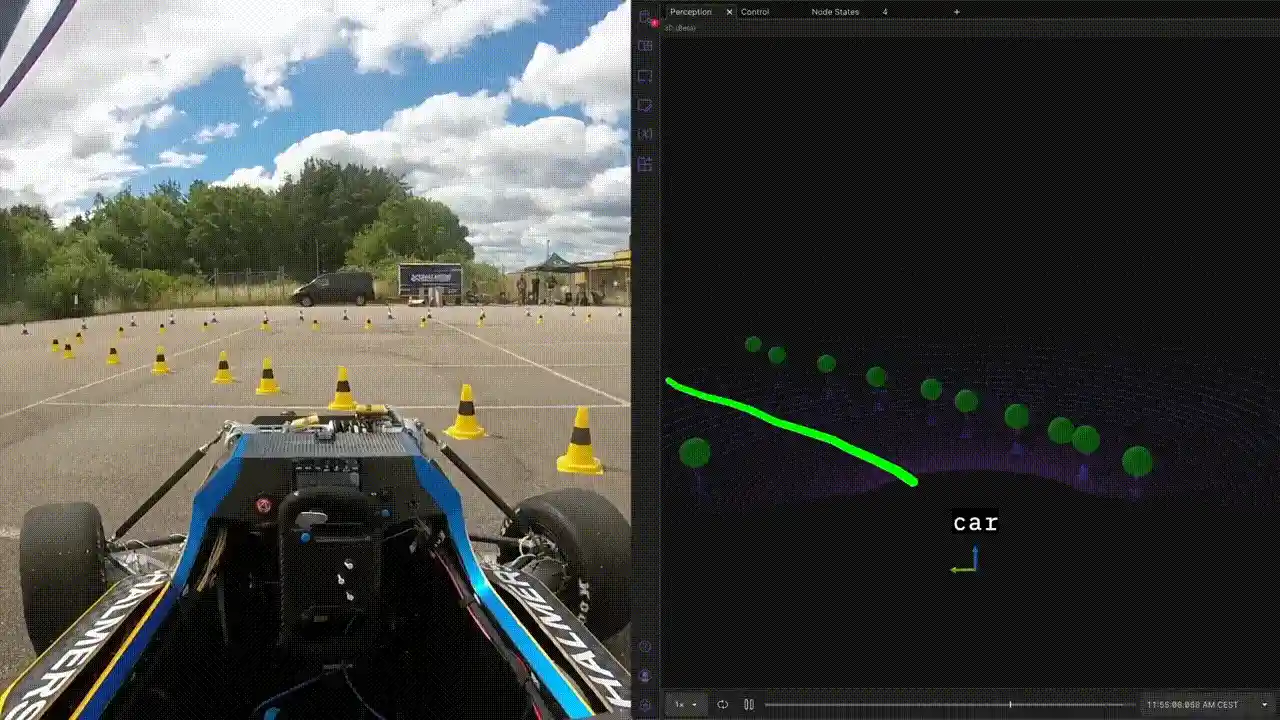
For our hardware stack, we chose a LiDAR as our main sensor – having accurate spatial awareness was of the utmost importance to our mission. While a camera may be very good at detecting different objects, we only have to deal with cones, which are easily detectable in a point cloud.
We decided to use an Intel i9 CPU for computations, as we didn’t have any heavy image detection algorithms that would require a GPU.
Since we wouldn’t have a human driver to steer or brake, we had to add some sort of actuation. We decided on an electric pancake motor for steering and implemented braking with a hydraulic pressure system. We also equipped the car with an Inertial Measurement Unit (IMU) to track its velocity and acceleration.
For our software framework, we chose ROS 2 Galactic, mainly because we knew that ROS 2 does not rely on a centralised ROS master anymore. Even though Galactic is not the LTS version, we preferred it over Foxy because we wanted to use Eclipse Cyclone DDS as our ROS middleware leverage new features like loading configuration files runtime or recording data with rosbag2’s improved performance.
Starting development
The physical car is only ready to drive quite late in the development process, so we are tasked with developing as much as possible without the actual car. As a result, we have to rely heavily on simulation to verify that our code works before it is ever loaded onto the car. We also had to streamline our deployment workflows so that the code could be loaded onto the car as seamlessly as possible when ready.
We started by running simulations on our local machines, then verifying that the pipeline worked on our dummy car (sensors mounted on a cart). Finally, we deployed the code on the racecar itself, when it was ready for final integration.
We dedicated a large portion of time creating a development environment with easy deployment and debuggability. Afterwards, we decided to run every ROS 2 node in its own Docker container. This simplified our dependencies without negatively impacting performance, as the host computer doesn’t even have to have ROS installed. This is especially beneficial given the fact that our team members all develop on different CPU architectures and operating systems.
Running into our first challenges
We wanted to run the driverless stack on the car’s computer and easily analyse it live as well as open and examine the logged data from any other device. Using rviz2 and rqt in this setup meant we had to run them inside Docker containers as well to ensure compatibility, which wasn’t the most convenient solution.
In the search for a better way, we found Foxglove. By providing live Rosbridge connections and a suite of panels that essentially replicated the functionality of rviz2 and rqt, Foxglove helped us circumvent our problem altogether:
We are currently leveraging Foxglove for three major use cases: analysing live data, analysing simulated data, and examining logged data.
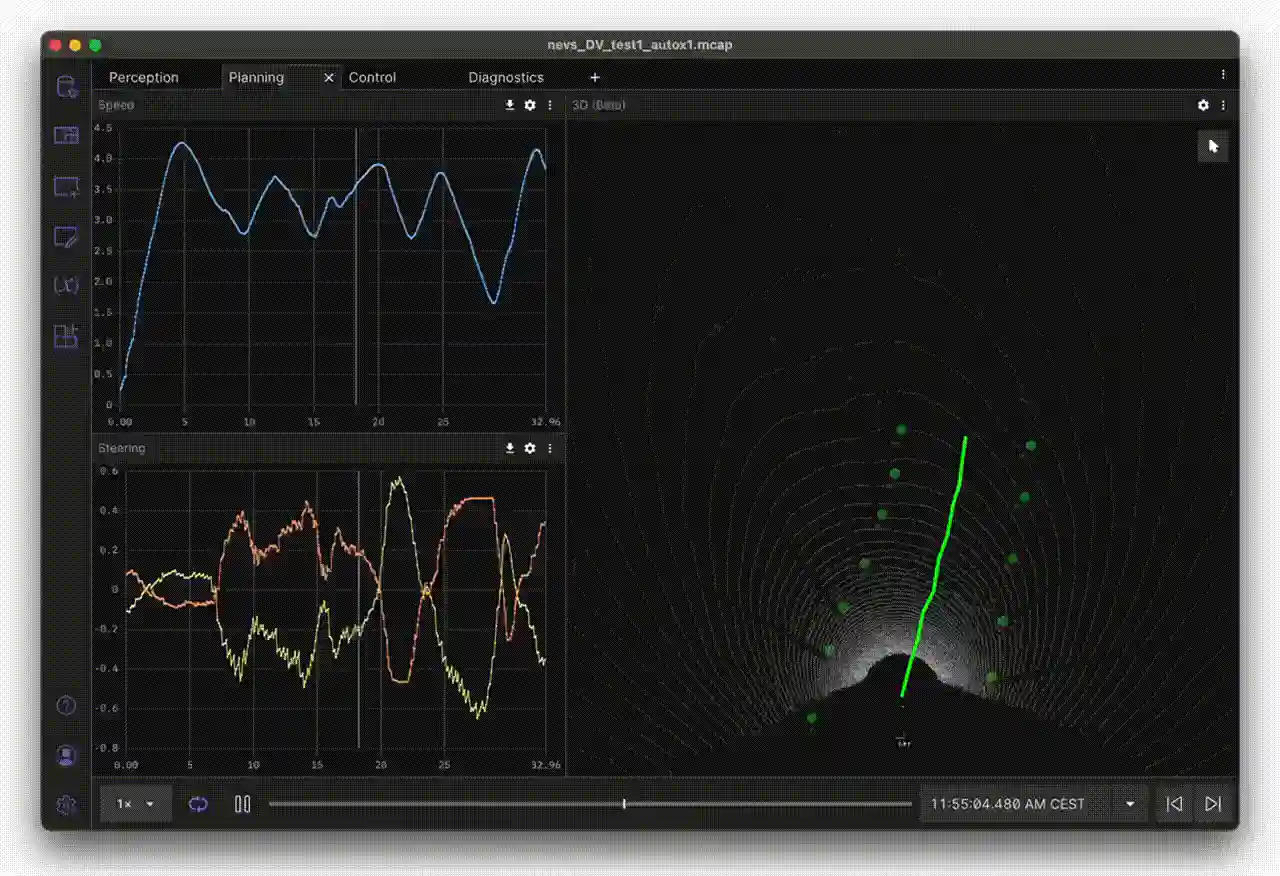
Analysing live and simulated data
We are using long-distance wifi for live telemetry, which unfortunately is restricted to 2 MB/s. This means we cannot possibly visualise any heavy data like a LiDAR point cloud live. This constraint also makes it impossible for us to simply share a network with the car to access all the ROS topics.
Foxglove’s Rosbridge connection was our saviour here, making it possible to send only key information like the states of each node or actuation commands:
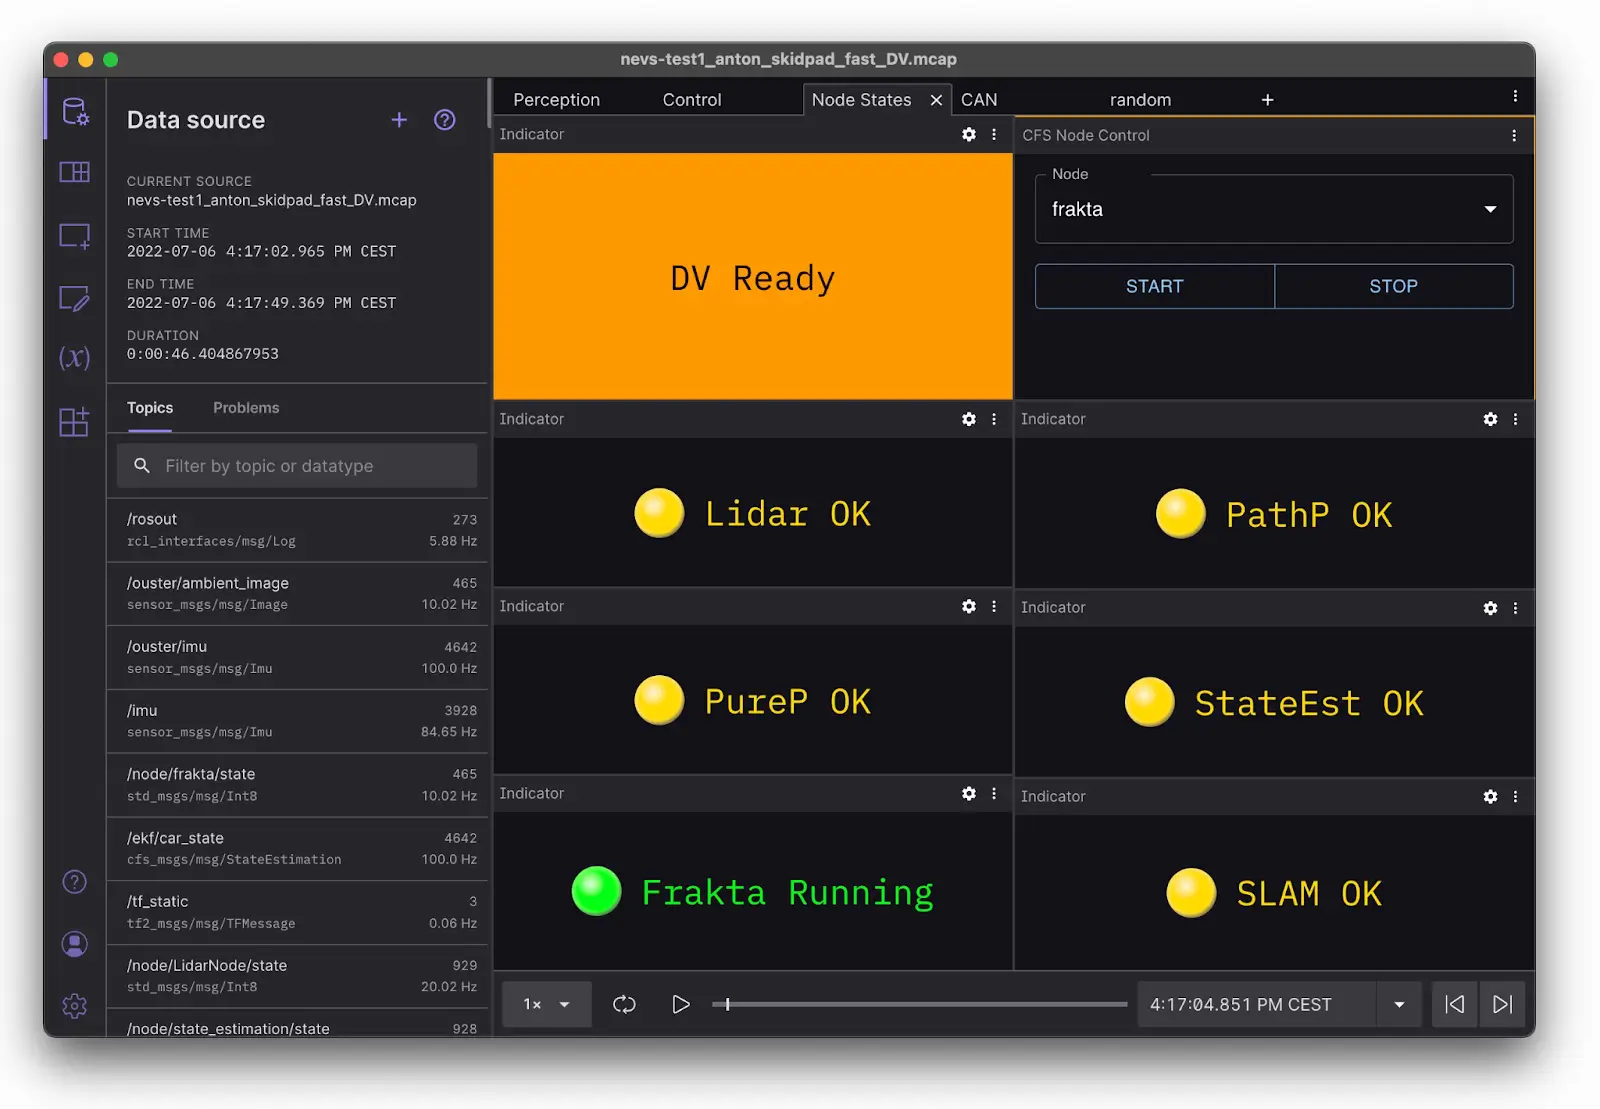
We also developed our own custom Foxglove extension (top right corner) to start and stop ROS nodes in real-time.
Foxglove also allows you to see your data on any device with a browser. This setup makes live debugging much faster, as we can pin down a problem without having to transfer and open logged data. We even developed our own Foxglove extension to control the nodes we wanted to run at different times.
When analysing simulated data, we simply replace live car data with our simulation data, without changing anything else in the pipeline. Whether we are in simulation or on the track, we are able to use an already familiar visualisation setup to help us take advantage of every minute that we have – whether the bounding factor is our limited development time, hours of daylight, or ounces of battery life.
Examining logged data using ROS bag files
Of course, there are times when we don’t immediately find the problems live, so we rely on post-analysis.
Every time we run the car for a lap around the track, we record all the topics to our local disk, and eventually offload the output log files for analysis. While standard ROS 2 bags with sqlite3 worked fairly well, we wanted to include message schemas in our data files, given that our system and messages are constantly evolving. Otherwise, we knew reproducibility would be a lot harder down the line, especially for a fast-evolving project like this where the team changes every year.
To solve these issues, we decided to record our data in the MCAP file format. MCAP introduced very impressive compression by default, reducing our files to roughly a third of their original size. It also helped us retrieve data when our car would experience issues and shut down randomly. We no longer had to deal with corrupted and unreadable files, since MCAP saves data sequentially in an append-only structure, making it much easier to recover data from interrupted recording. We no longer lost valuable information about our car’s performance during these critical events – information that was crucial to helping us iterate and improve on it.
We also decided to store and manage our data using Foxglove. The ability to stream our data directly from Foxglove helped us analyse logged data without having to copy an entire file to our local machines. Given the massive size of our files and the limited space on our computers, we would’ve only been able to store a few of these files at a time. Streaming was absolutely essential to simplifying and accelerating our workflows.
Conclusion
As a whole, Foxglove has helped our team solve the difficulties of cross-platform data visualisation, data storage, and replay much more elegantly. This, in turn, unlocks more efficient debugging workflows that streamline our general development.
We also appreciate how quickly Foxglove continues to be developed – we see noticeable improvements with every weekly release. We’re excited to take even fuller advantage of the breadth of Foxglove’s tooling. For example, our team is working on implementing a post-processing step where we automatically tag and upload our recorded bag files to Foxglove, for easier team-wide searching and analysis.
Our team is competing in the manual class for FS Austria and the driverless class in FS East this year. If you are curious about further updates, follow us on our LinkedIn or Instagram.