Visualization
One workspace to visualize and review robot behavior across teams.
Turn robot runs into answers, faster.
Visualization is the shared workspace for inspecting robot behavior across time and modalities, replacing ad hoc scripts with reusable views so teams ship faster.
01
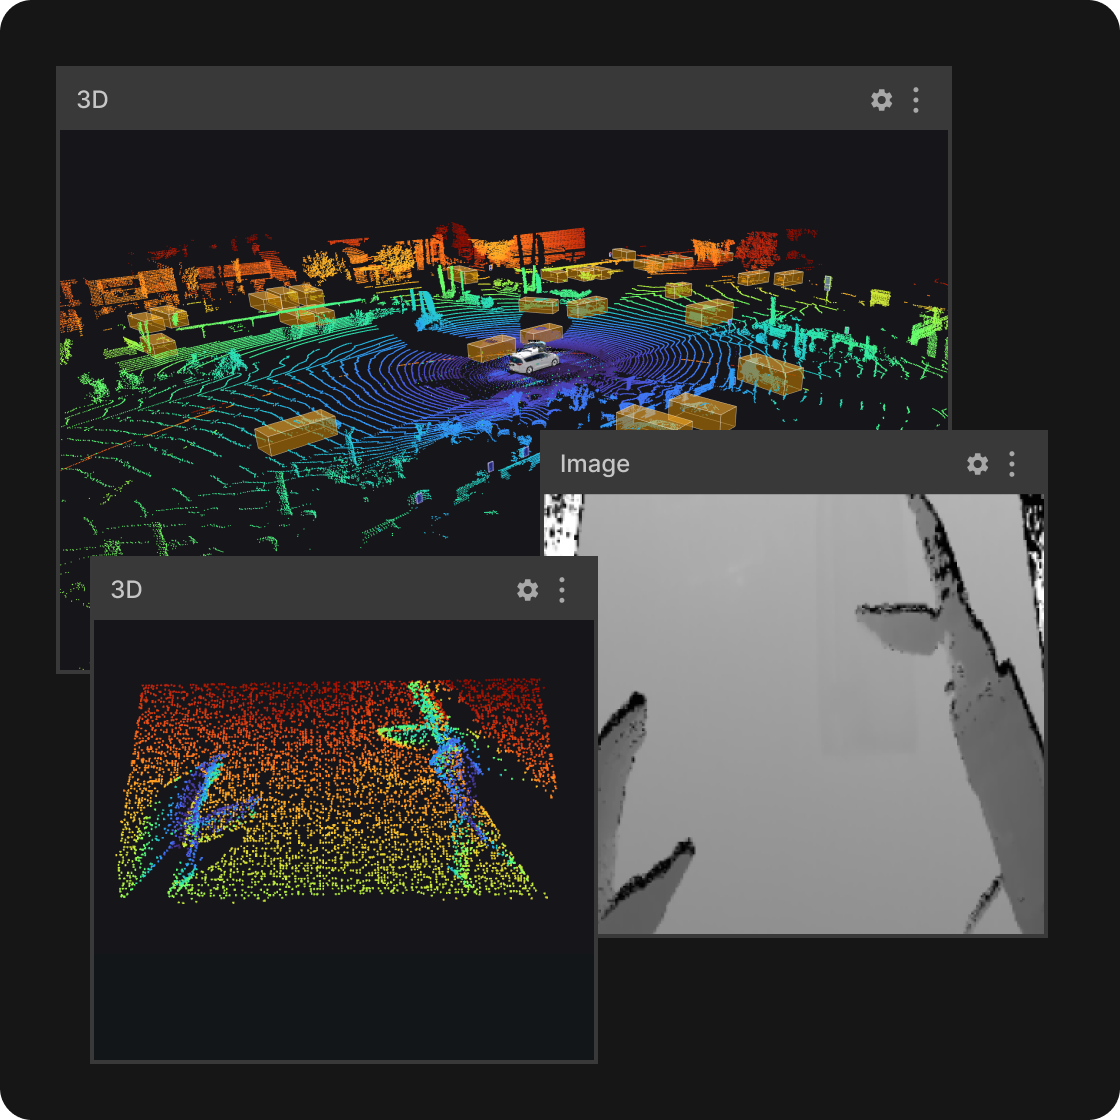
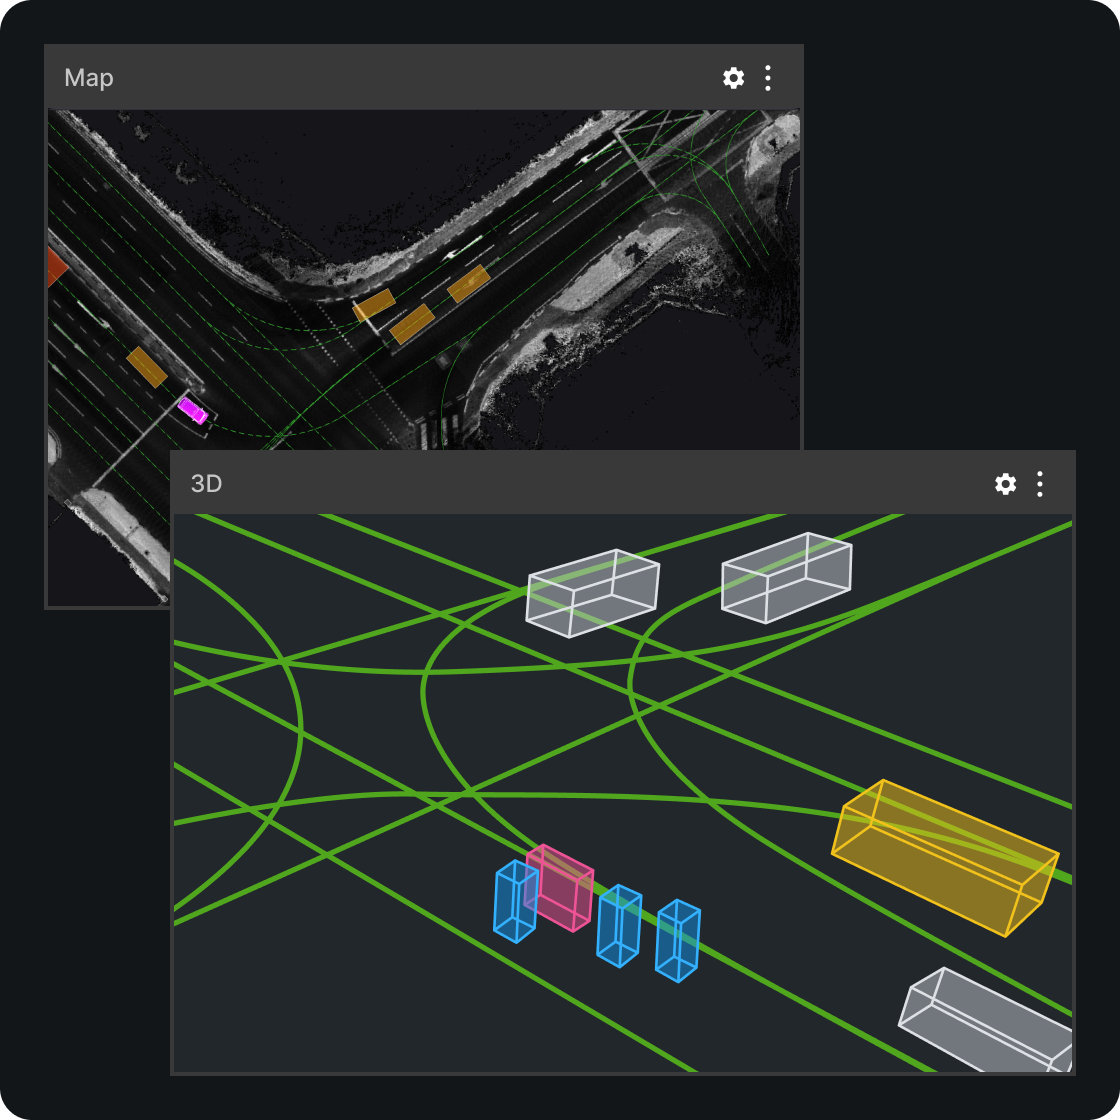
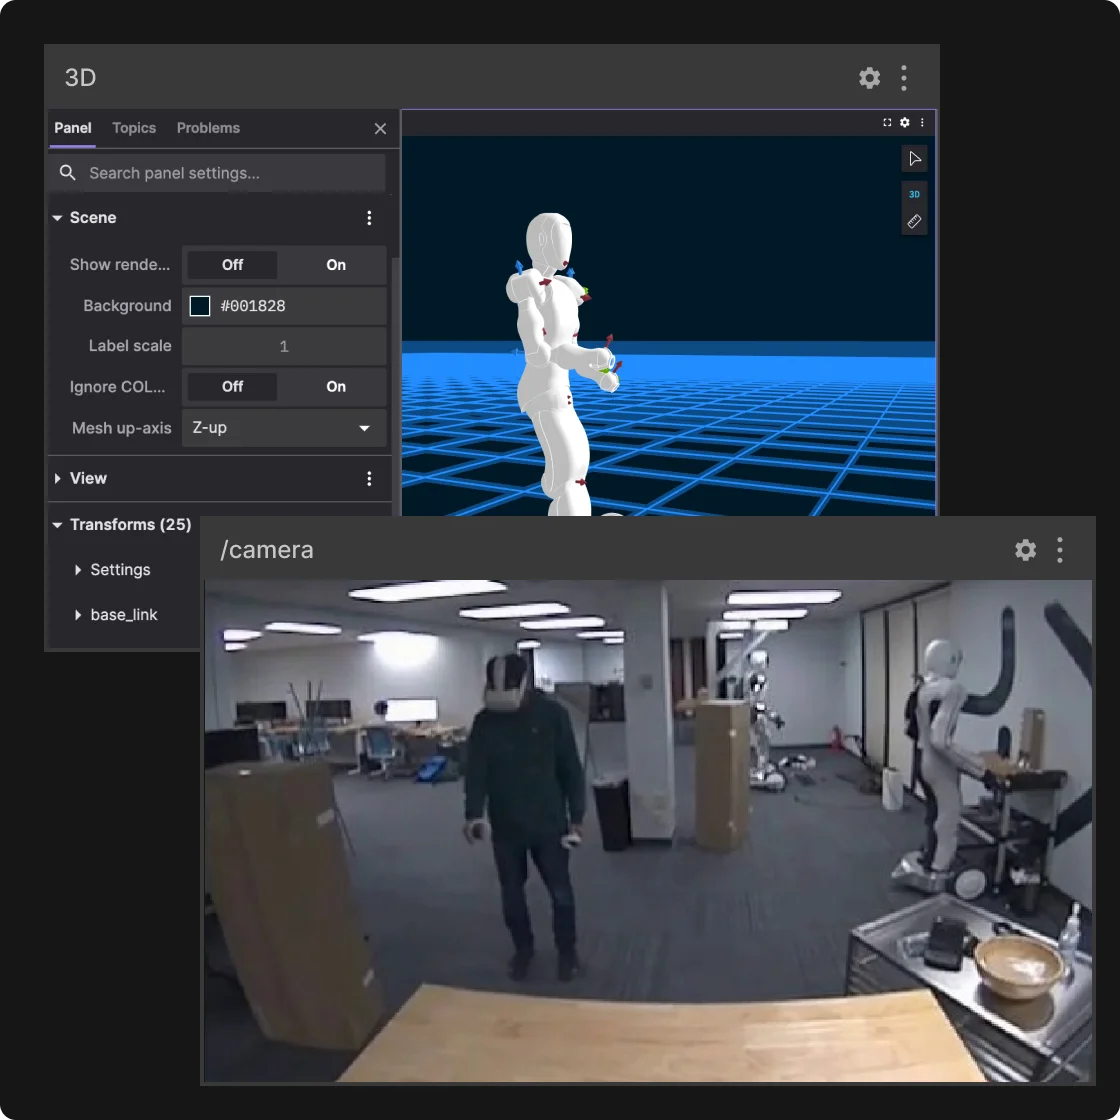
Correlate robot behavior across modalities.
Bring 3D, video, transforms, annotations, and maps into one time-synced view so you can see what the robot perceived, decided, and did, in real-world context.
02
Reproduce issues and validate fixes from live to playback.
Use the same layouts and tools to debug live systems, then replay recordings with consistent playback to reproduce failures, confirm hypotheses, and validate changes without starting over.
03
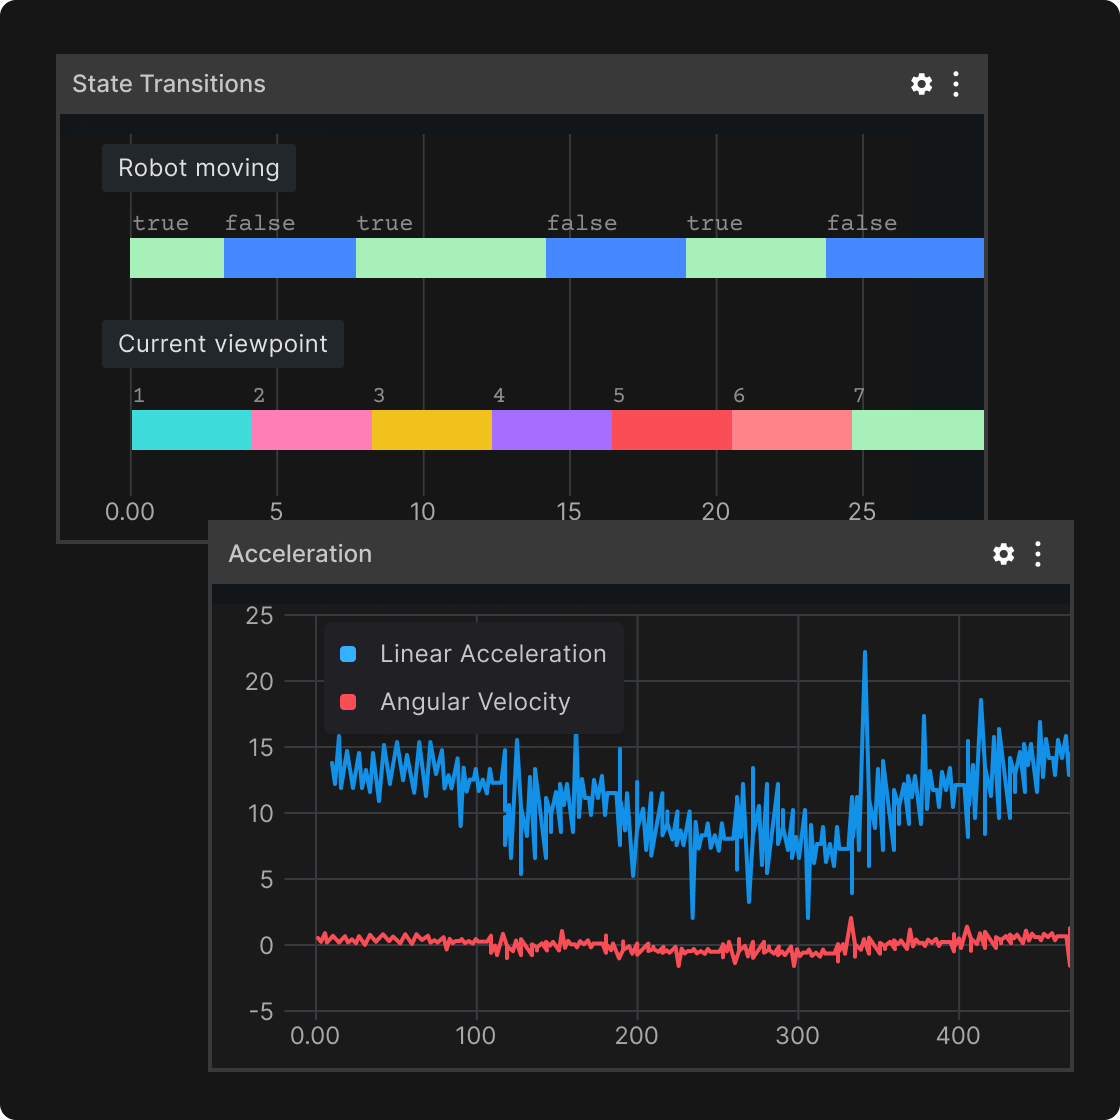
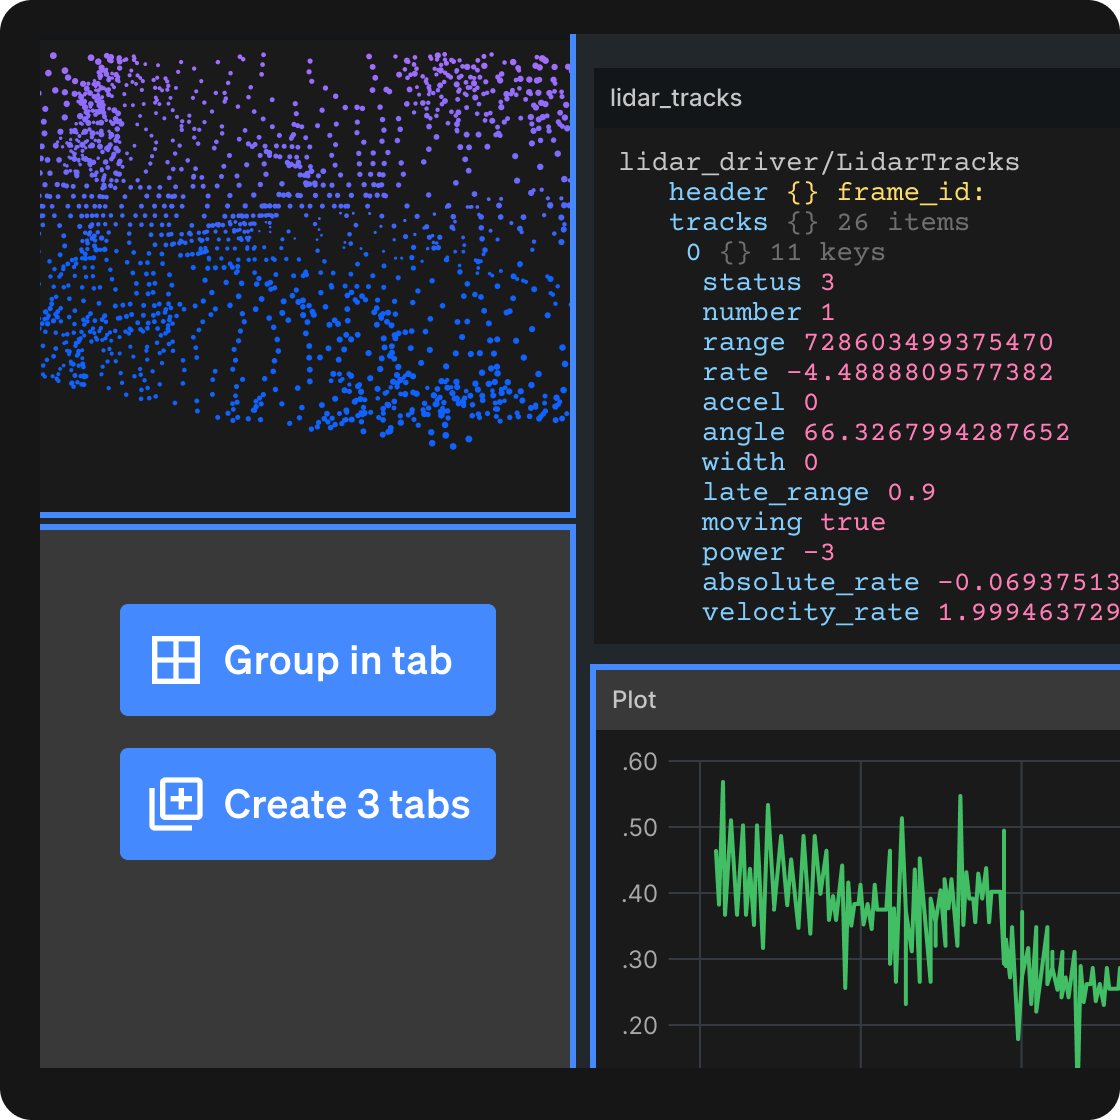
Find the exact moment and signal that matters.
Go from “something’s off” to the precise timestamp and data that explains why using plots, state transitions, and raw message inspection to isolate events and verify behavior.
04
Standardize workflows across your team and stack.
Share layouts and shareable links to align the team, adopt quickly with MCAP, ROS, and Protobuf support across local files or cloud recordings, and move from insight to action by publishing and testing changes against your live stack.
05
Extend Visualization access to more teams.
Make Visualization easier to roll out beyond engineering with read-only access to Foxglove-managed data and workflows. Give QA, triage, teleoperations, safety review, and management a shared interface for inspecting cloud recordings, events, live robot activity, and saved layouts.
How it works.
Connect to live robots and recordings
Stream from your stack or open recorded runs, then move seamlessly between live debugging and replay.
Build a workspace for each workflow
Combine 20+ panels into layouts for bring-up, autonomy debugging, regression validation, or field ops, and reuse them across the team: 3D | Diagnostics | Images | Plot | Publish | Raw Messages | State Transitions | Table | Map.
Investigate, validate, and share what you found
Scrub to the moment that matters, correlate signals, then share a layout so engineering can debug and teams across QA, operations, and safety can review the same run in a consistent read-only workspace.