Announcing: A lightning-fast Timeline view.
The Foxglove Timeline is over 100x faster.

The Timeline view in Foxglove displays each device’s data availability across time. It highlights whether data is ready to stream, actively being processed, or available for import from your robot’s disk using the Foxglove Agent.
Use the Timeline to zoom in on specific devices and time ranges to see the status of your data. From there, you can fetch data that’s available for import, visualize it for in-depth analysis, or export it for use with other tools.
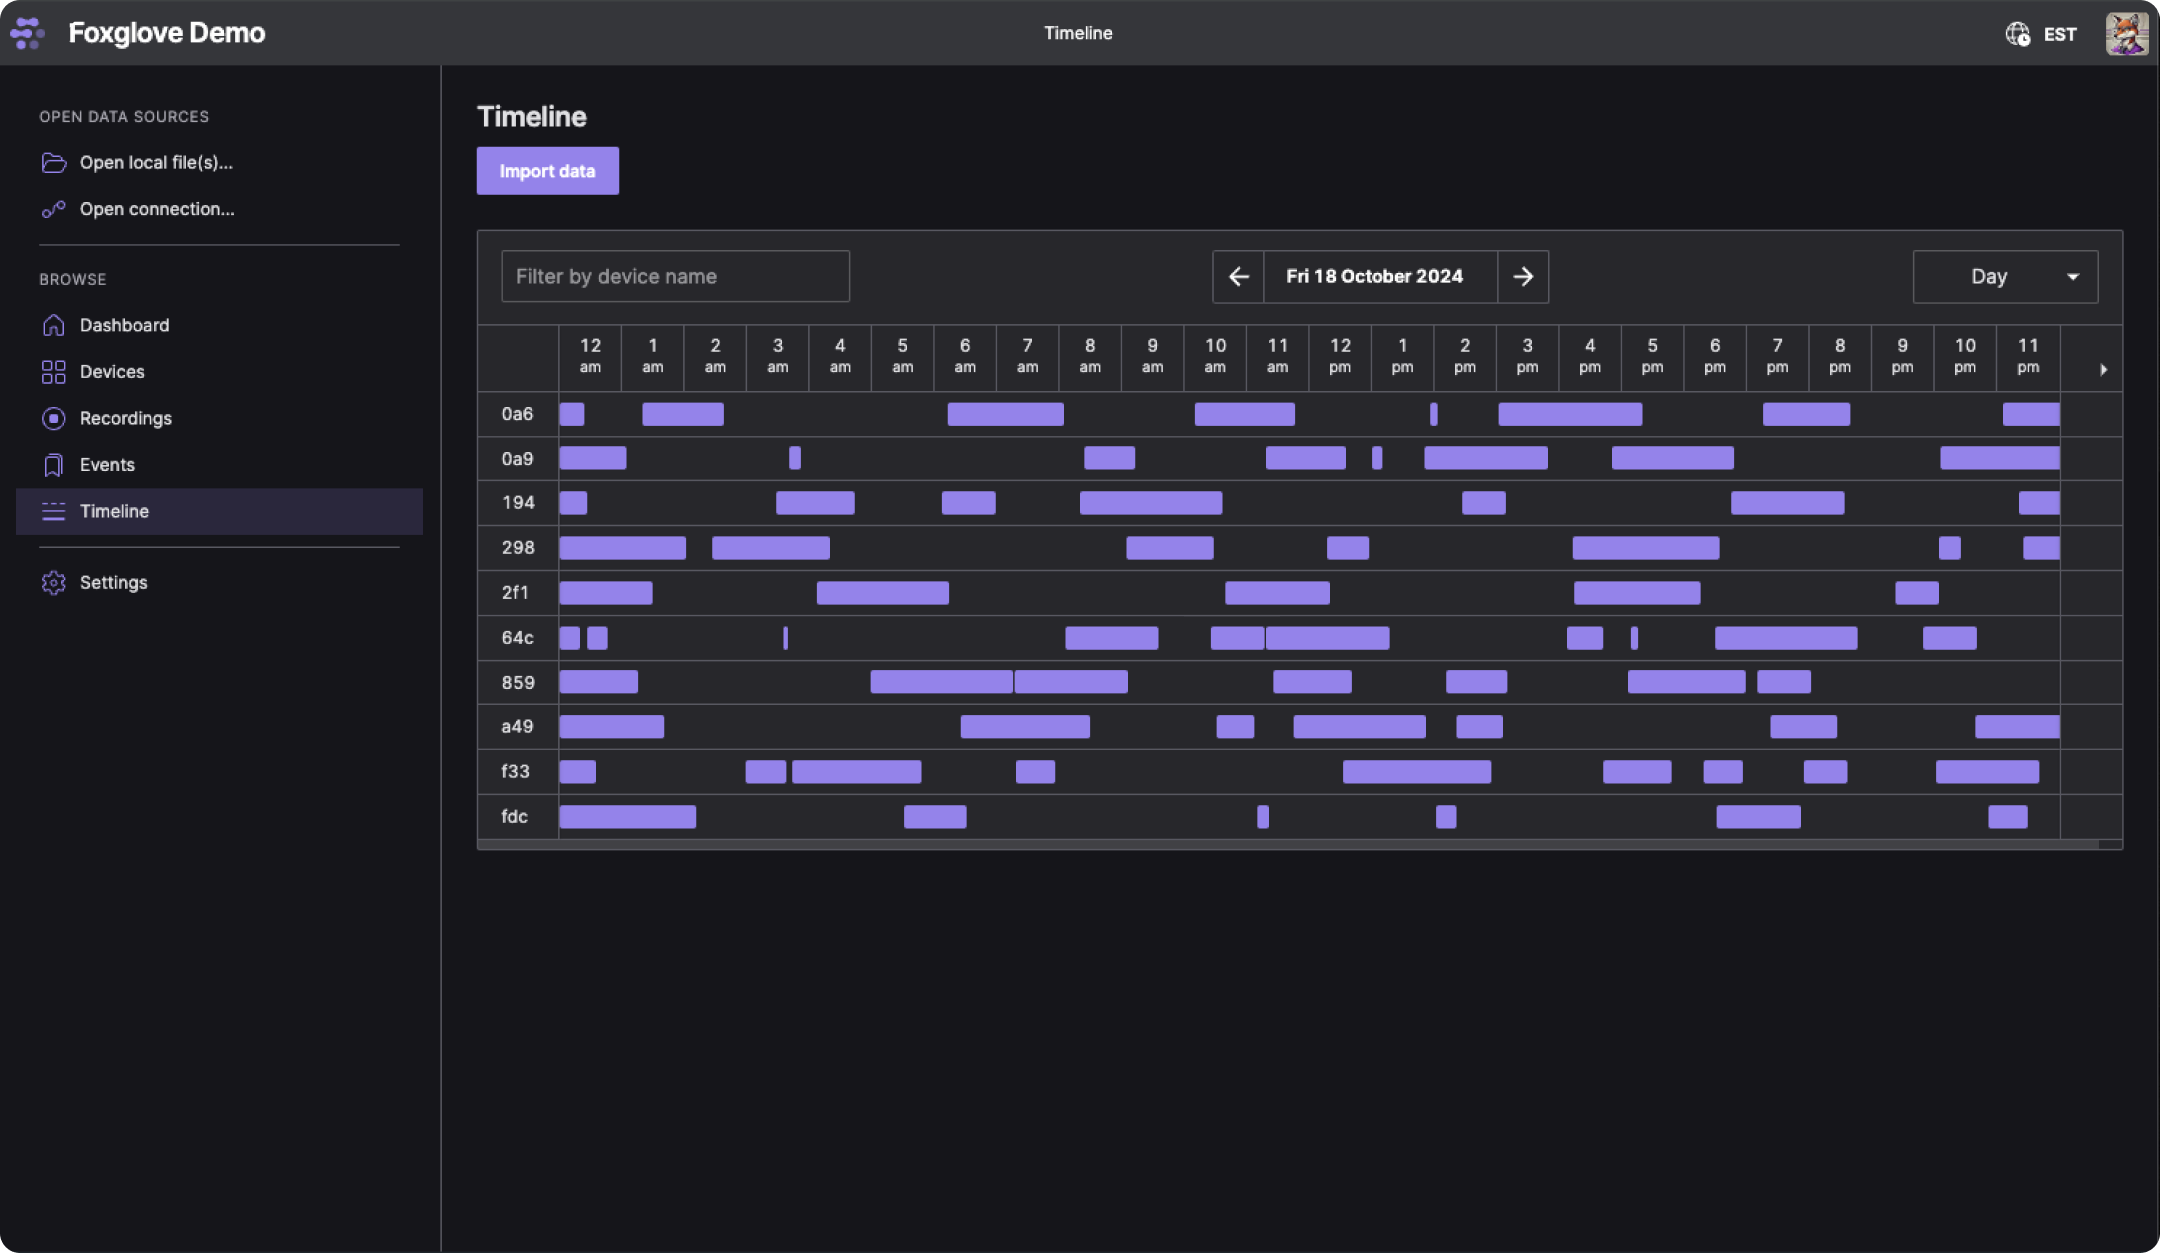
A screenshot of the Foxglove Timeline view.
A screenshot of the Foxglove Timeline view.
What’s new?
With these updates, there hasn’t been any new functionality added to the Timeline, but it got fast. Really fast. Foxglove manages many petabytes of robotics data, and still, the new Timeline can fetch and visualize coverage for a year’s worth of data from the heaviest datasets in < 1 second.
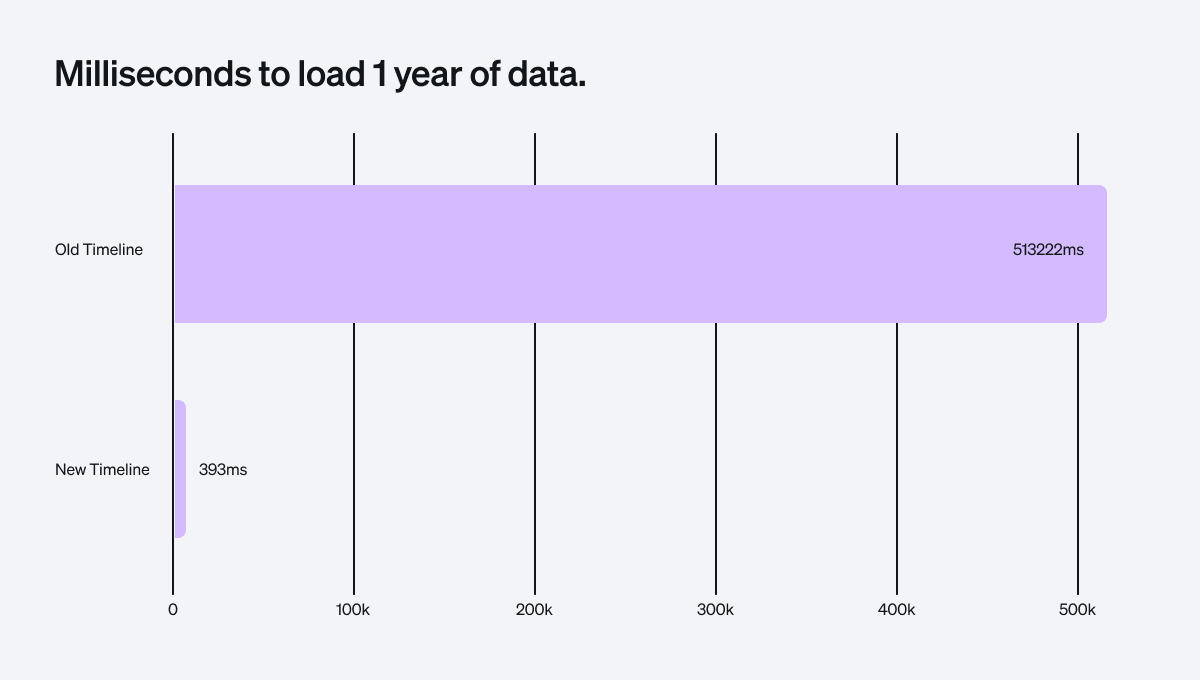
A chart showing the old vs. new timeline query results.
A chart showing the old vs. new timeline query results.
This increase in speed means that you can fluidly zoom out to see the complete state of your data and then zoom in on the periods that interest you most. When you are informed that something potentially happened with a particular device, snap straight to that time range and start investigating.
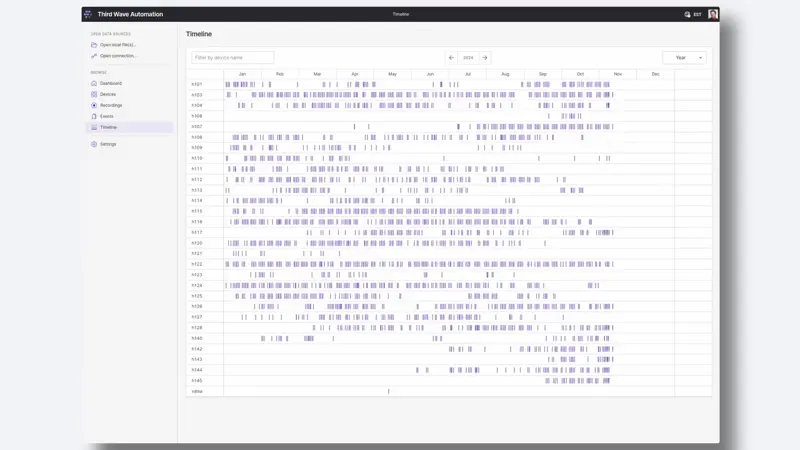
The Foxglove Timeline visualizing a year’s worth of data, seamlessly zooming into a single point of interest for detailed analysis. (Video credit: Third Wave Automation)
The Foxglove Timeline visualizing a year’s worth of data, seamlessly zooming into a single point of interest for detailed analysis. (Video credit: Third Wave Automation)
Using the Timeline with Agents and Edge Sites
The Timeline also integrates with Edge Sites and the Foxglove Agent to give you insights into the data available on your robot’s disk or servers running in the field. Using the same blazing-fast interface that allows you to see what data you have in the cloud, you can inspect and fetch data from your devices, streamlining the entire process of accessing and managing your data.
If you want to take advantage of the indexing in other ways, you can directly query the Coverage API that powers the Timeline view.
How we made the Timeline lightning-fast.
The Timeline view has gradually evolved from a basic query into a sophisticated, feature-rich interface, performing extensive real-time aggregation. The original implementation needed to be optimized for better scalability as usage expanded. For some of Foxglove’s power users, the performance became a challenge; in the most demanding cases, the underlying query could take up to 8 minutes to complete.
The initial approach to tackle this issue was straightforward: use EXPLAIN ANALYZE to profile the query, pinpoint the slow parts, then adjust the indices or schema to optimize performance. This revealed that the query is sometimes slow because it does a full table scan over a very large table. That’s not surprising, as that’s often the insight from EXPLAIN, and the fix is usually to add an index so the planner can avoid scanning the full table. However, in this case, the query was performing extensive data aggregation, and it had to process a significant portion of rows. The challenge was to find a way to access less data while still including all necessary information—something no index could resolve. The question became, how does one access all the data without actually accessing all of it, and still retain real-time updates?
The recordings table being scanned includes two dozen columns, but for the coverage endpoint, only a few specific fields—organization ID, device ID, device name, import status, and data start and end timestamps—are necessary. Adding a covering index for these fields could reduce the amount of data scanned by approximately 25%. However, this optimization alone is insufficient to ensure fast performance in all scenarios.
The only feasible solution was to perform as much aggregation in advance as possible. This way, the query could still include all relevant data but would not need to process as many rows each time. A quick proof of concept was set up to cache this aggregated data in a separate table, using only organization ID, device ID, device name, import status, and data start and end timestamps. This resulted in a 100x improvement in performance, reducing the worst-case query time from ~8 minutes to only 200 milliseconds!
Then the real challenge began. Timeline data constantly shifts as new data arrives, old data is removed, and multiple state changes happen in quick succession when an import is initiated. Pinpointing all areas in the codebase that could modify any portion of this pre-aggregated data, then devising a way to identify and replace the affected parts of the Timeline and re-amortize them is what was needed.
The challenges with cache invalidation.
There are two distinctively challenging problems in computer science. Naming things, cache invalidation, and off by one errors. Cache invalidation is famously challenging, and it only grows more complex when dealing with aggregated data. We can confirm this from experience—every layer of aggregation introduces new complications. Along the way, several difficult obstacles were encountered, each requiring careful consideration and precise adjustments to maintain data integrity while ensuring efficient performance.
Some of the challenges.
Real-time requirement for cache invalidation.
Caches often can handle minor delays—if stale data is briefly displayed, it might not matter. In that case a simple timeout might be all the invalidation needed. However, in our case, users want to explore current data or to watch import statuses update in real-time. This demand for immediacy requires low-latency, fine-grained invalidation, which ruled out implementing a simple time-delayed cache.
Initial SQL trigger solution.
Initially, using update/insert/delete SQL triggers for instant invalidation was attempted. However, sometimes large chunks of aggregated data had to be removed and rebuilt, which can be a time-consuming task operation. The synchronous nature of triggers impacted operation latency, delaying the triggering request until the invalidation could complete. Doing partial invalidations via triggers was also explored, but this approach was difficult to synchronize with other concurrent invalidations happening in code.
Code-based invalidation approach.
All the invalidation in code has been re-implemented, but for performance, invalidation has been moved to the background, avoiding any hit to the triggering operations’ latency. While some background task capabilities existed, a fine-grained task queue system for this approach is needed. We didn’t want to use a proprietary cloud service for the queue, because some customers want to run the software on-premises, on their own hardware. We couldn’t add a cloud dependency that would prevent that workflow. To this end, a PostgreSQL-based task queue using SELECT SKIP LOCKED was the chosen option. We already use PostgreSQL, so wouldn’t add complexity to running the software stack.
Performance optimization.
Once everything was wired up, including the background runner and all invalidation points, the invalidation process couldn’t keep up with the volume of work. Aggressive optimization eventually made the invalidation code 100x faster by making it more fine-grained, batching tasks, and running them concurrently. The fastest work is the work you don’t do.
Quality assurance and verification.
To verify the cache’s accuracy, scripts that periodically check for discrepancies between the live cache and a freshly built cache were created. This was challenging in a live system, so the issue was sidestepped by restoring a database snapshot as a new database, and running the comparisons on it.
To get started, login to Foxglove and upload a recording.
Everyone, including Foxglove’s Free plan users, has access to the timeline, and even the Free plan comes with 10GB of cloud storage built-in (in addition to unlimited local data playback).
If you haven’t used Foxglove yet, try it out for yourself today and join our community to let us know what you think.

