Use the Foxglove SDK for real-time industrial PLC data visualization and playback.

Industrial control systems produce a wealth of valuable real-time data—data that is often locked away inside programmable logic controllers (PLCs) and difficult to stream or visualize effectively. At Foxglove, we asked: Could we use our tools to bridge that gap? Could Foxglove become a live dashboard and analysis platform for industrial data, from simulated plants to factory floors?
In this tutorial, we put that idea to the test by creating a simple script that streams EtherNet/IP tag data to a live Foxglove WebSocket server, enabling real-time visualization and logging using standard Foxglove layouts and MCAP recording—all thanks to our Foxglove-SDK.
Simulating the plant and bridge.
Using cpppo and pylogix, we simulate a complete PLC-like environment. The system includes:
-
A virtual Ethernet/IP device serving tag data.
-
A Python-driven simulated plant generating and updating tag values.
-
A Foxglove bridge script that translates tag updates into Foxglove channels over WebSocket (ws://localhost:8765).
Once connected, Foxglove can display these time-series streams using built-in panels or record them in MCAP format for offline analysis and replay.
Industrial data meets modern tooling.
With this integration, Foxglove becomes more than a robotics tool—it becomes a viable solution for industrial telemetry, SCADA-lite dashboards, and PLC debugging. Engineers can now:
- Stream live sensor or actuator data from industrial control loops.
- Log complete test runs in MCAP for postmortem reviews.
- Customize layouts for factory or test cell diagnostics.
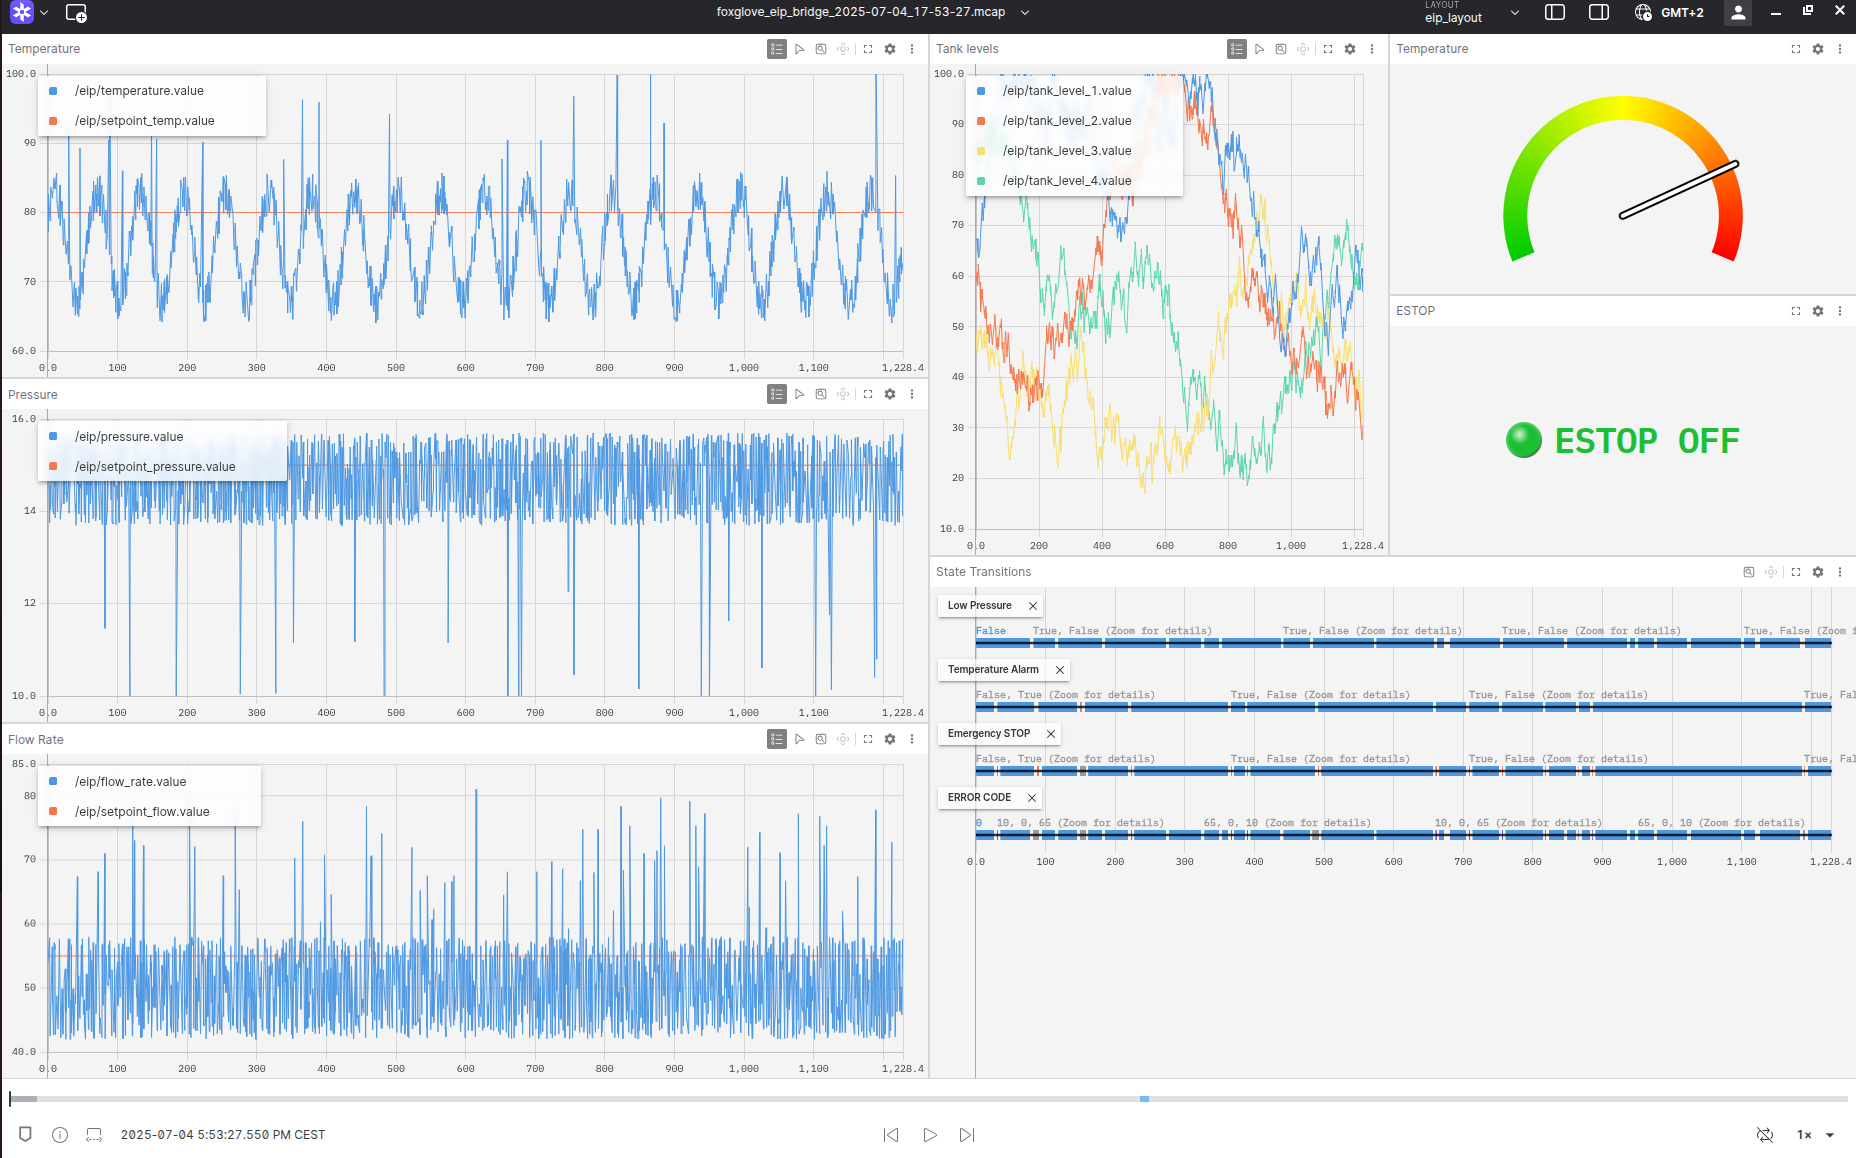
Foxglove panels.
To bring the data to life, we leveraged several built-in panels in Foxglove:
Plot
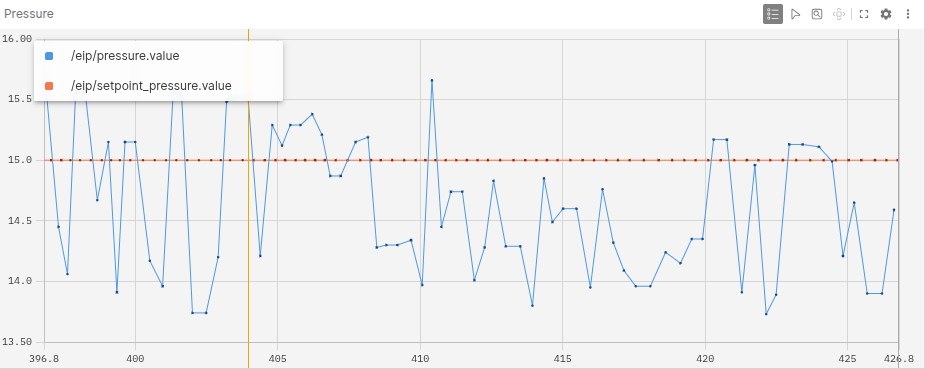
For real-time trend monitoring of analog values such as pressure, flow, or temperature tags.
Indicator
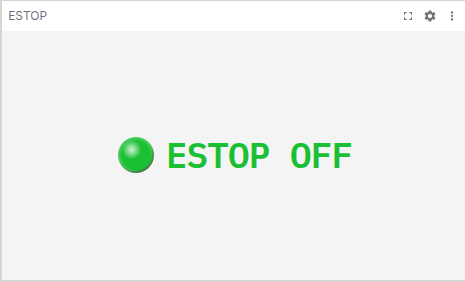
For binary signals like sensor trips or relay states, perfect for showing alarms or status LEDs.
Gauge
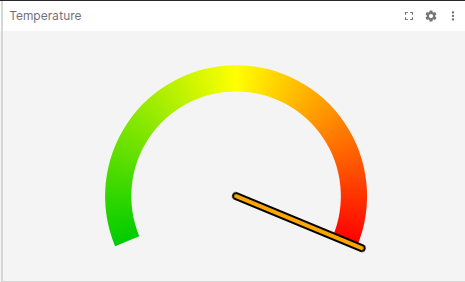
For intuitive display of scalar quantities (tank level, motor RPM, temperatures, etc.) with thresholds and ranges.
State Transitions
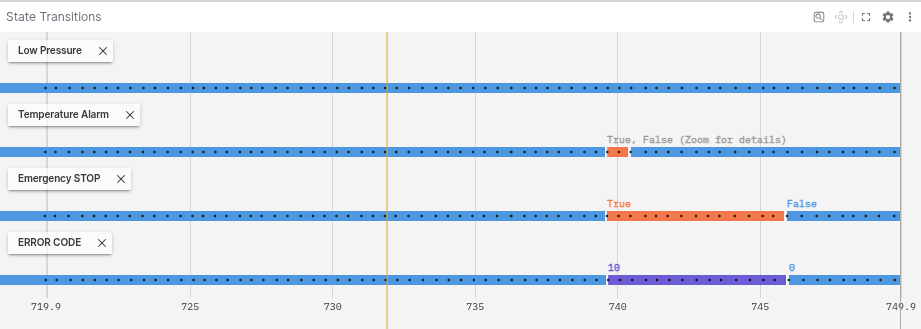
To trace discrete state changes over time, such as error codes.
These and other panels available in Foxglove allow you to build rich, responsive dashboards that mirror industrial HMIs, using the same raw data flowing out of PLCs.
Logging data.
Recording industrial data has never been easier. Using the Foxglove SDK, you can log all streamed tag data directly to the MCAP format, our efficient, open standard for storing time-series telemetry.
In the repository, you will find an MCAP file containing a recording of 20 minutes and 30 seconds in length. It includes 110,005 data points from 35 Ethernet/IP tags, with a file size of 3.6 Mb. You can open this file in Foxglove to visualize all the datapoints that we logged.
With our Foxglove Agent, you can further extend this approach by logging all your device data 24/7 and consolidating all historical data for all your devices in a single place.
Why it matters.
As Industry 4.0 pushes for smarter, more connected operations, flexible and open tooling is essential. Foxglove’s ability to visualize PLC tag data in real-time, run on any OS, and log structured data provides engineers with a powerful new option, eliminating the need to purchase expensive commercial SCADA software.
Want to try it yourself? Check out our tutorial repository.