Announcing Programmatic Layouts in Foxglove
Define, compose, and reuse Foxglove layouts entirely from code in Notebooks


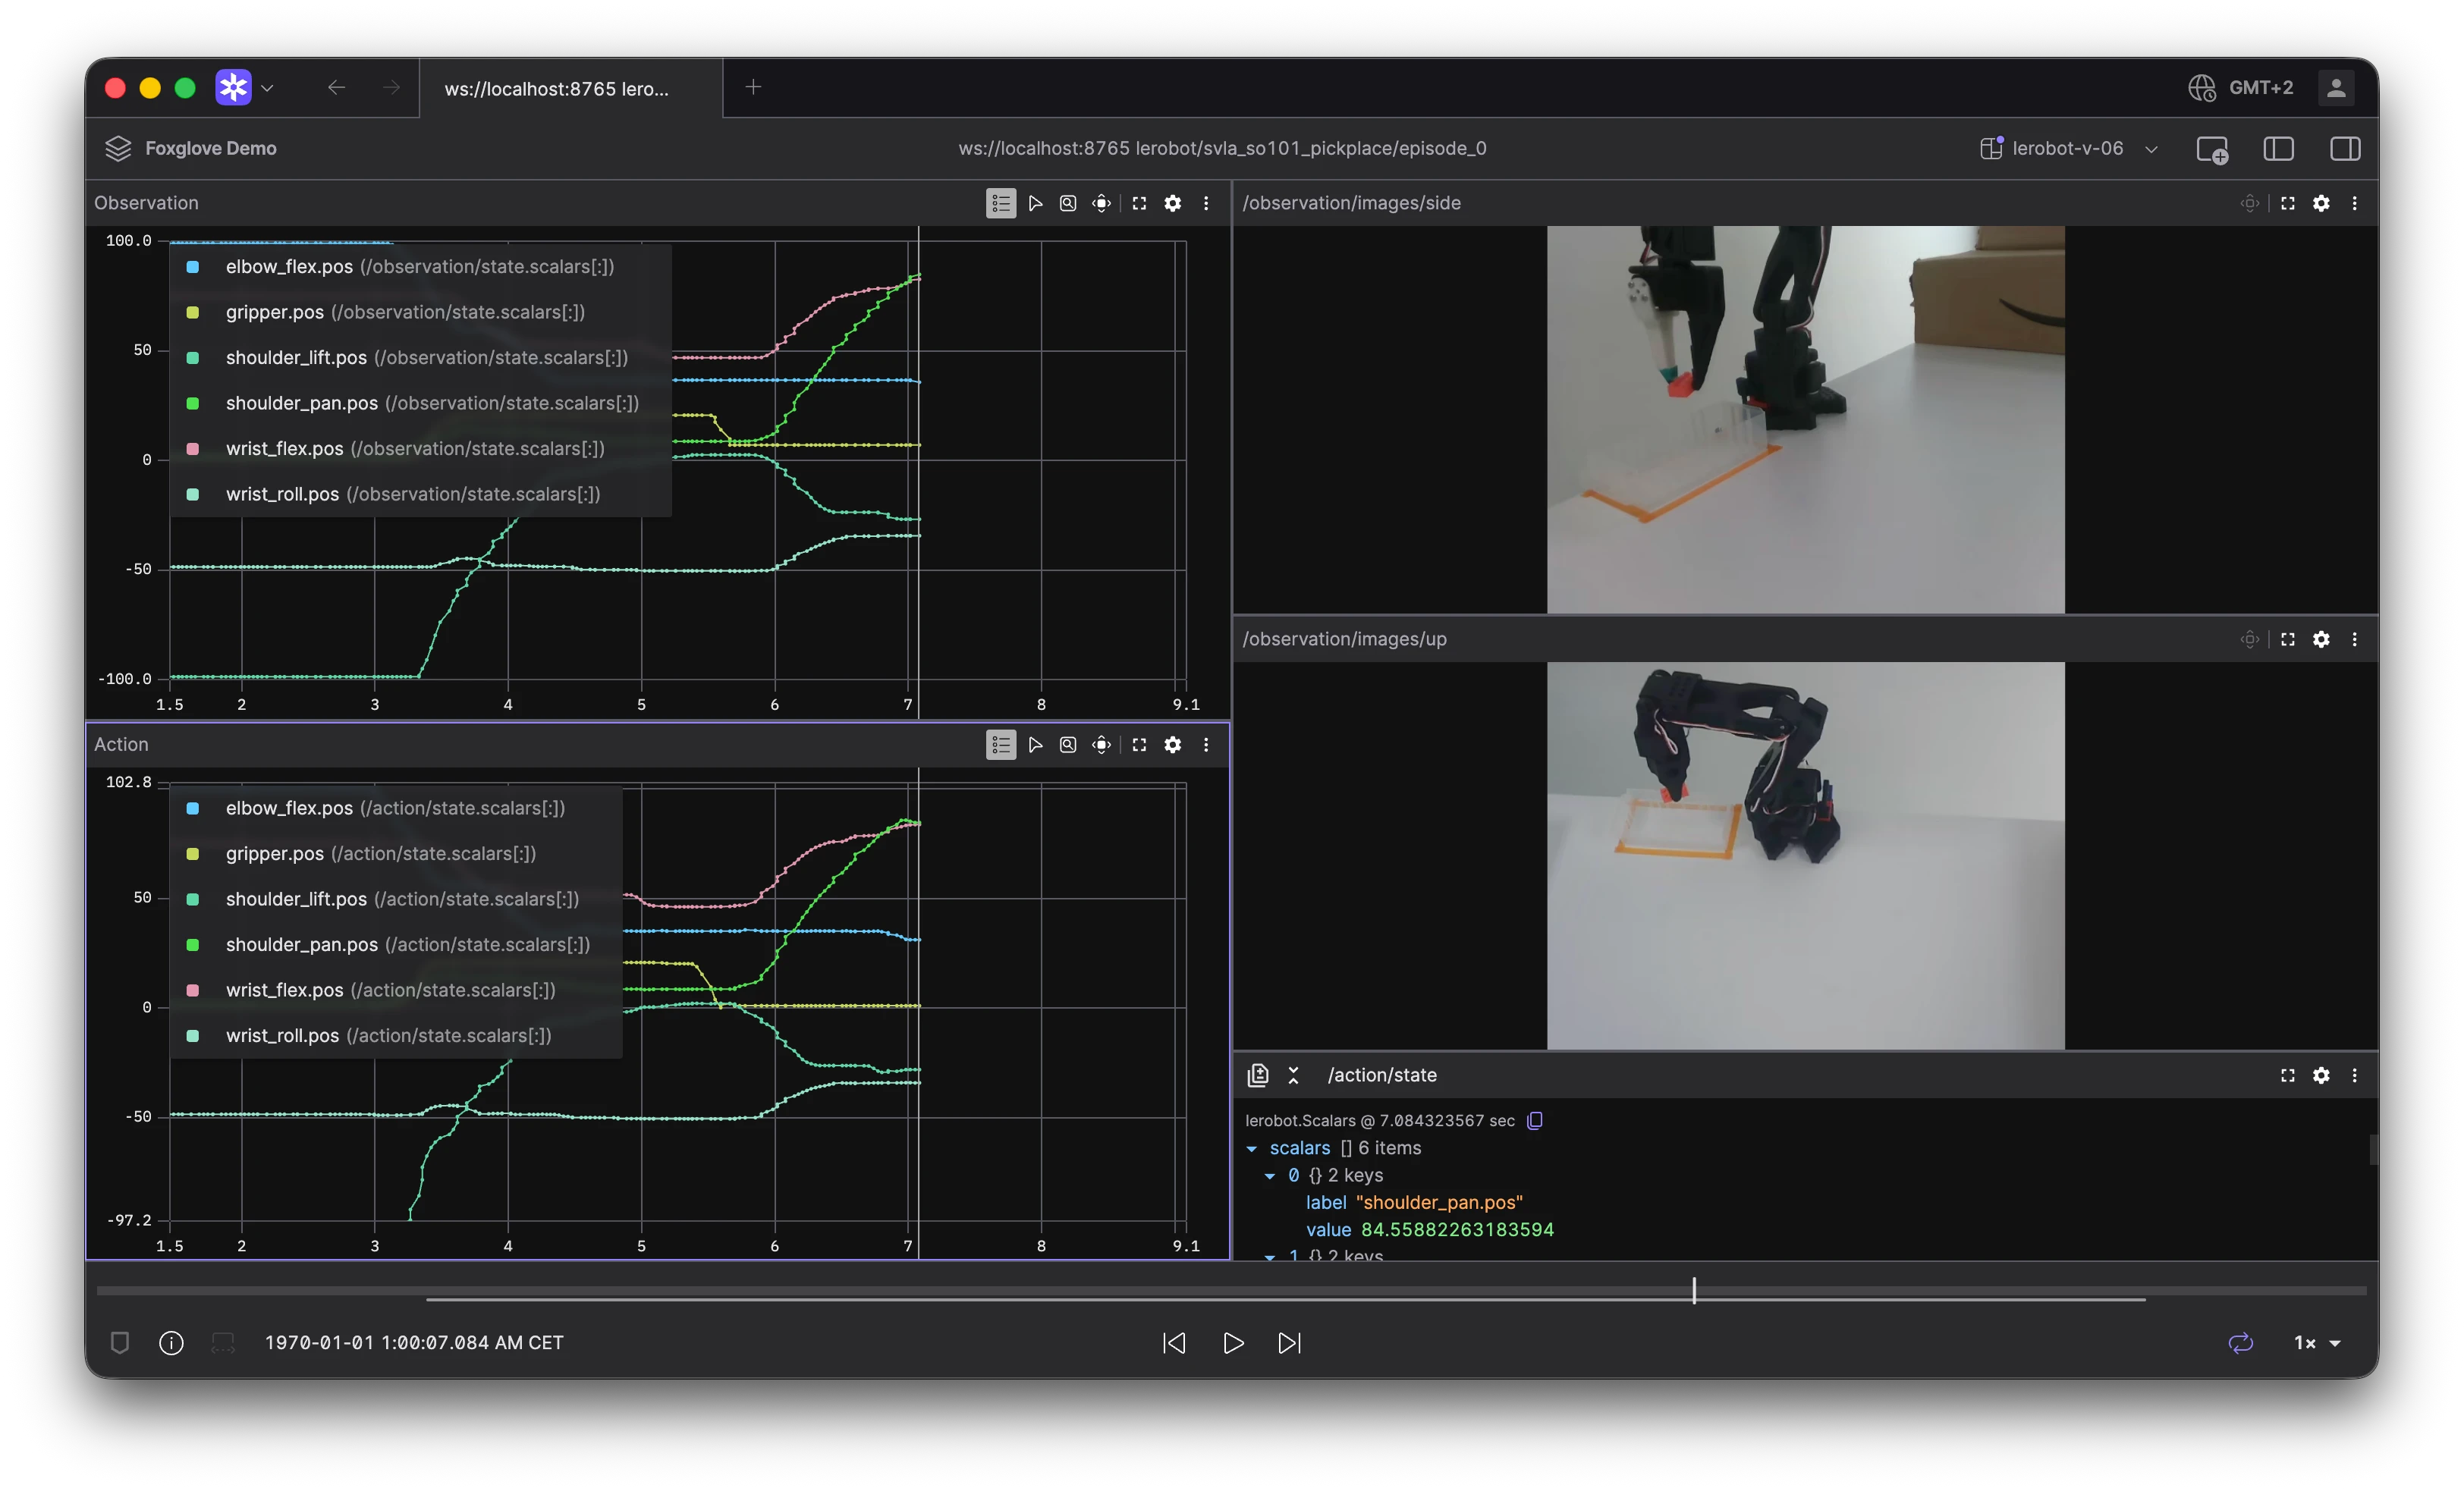
Robotics experiments often involve a wide variety of data — 3D scenes, camera feeds, sensor plots, state transitions, and more. Foxglove’s layouts let you arrange panels to visualize all of this data at once, but until now, creating those layouts required manual configuration in the app or loading opaque JSON files exported from a previous session.
Foxglove’s new programmatic layout API lets you define layouts entirely in Python. Build layouts that adapt to your data, compose reusable layout fragments, and pass them directly to the embedded Foxglove viewer in your Jupyter notebooks — all without ever leaving your code.
The problem
Until now, using our Jupyter notebook integration has required that you either manually arrange panels in the embedded viewer or preload a layout exported from the app as a JSON file. This approach has some limitations:
-
Data-dependent layouts: What if you want your layout to depend on the data? For example, adding a Plot panel with a series for each topic you’re logging — which may vary from experiment to experiment.
-
Composability: What if you want to combine pieces of layouts to create a new layout for a specific visualization? Merging exported JSON files by hand is tedious and error-prone, since the internal format includes implementation details that aren’t meant for manual editing.
-
Reproducibility: What if you want your notebook to be fully self-contained, so that anyone running it sees exactly the same visualization without needing a separate layout file?
Getting started with programmatic layouts
The foxglove.layouts module provides a collection of Python dataclasses for constructing layouts. Import the classes you need, compose them into a Layout, and pass it to nb_buffer.show().
A simple layout
Here’s the simplest possible layout — a single Raw Messages panel:
import foxglove
from foxglove.layouts import Layout, RawMessagesPanel

nb_buffer = foxglove.init_notebook_buffer()

# ... log some data ...

raw_message_layout = Layout(content=RawMessagesPanel())
nb_buffer.show(layout=raw_message_layout)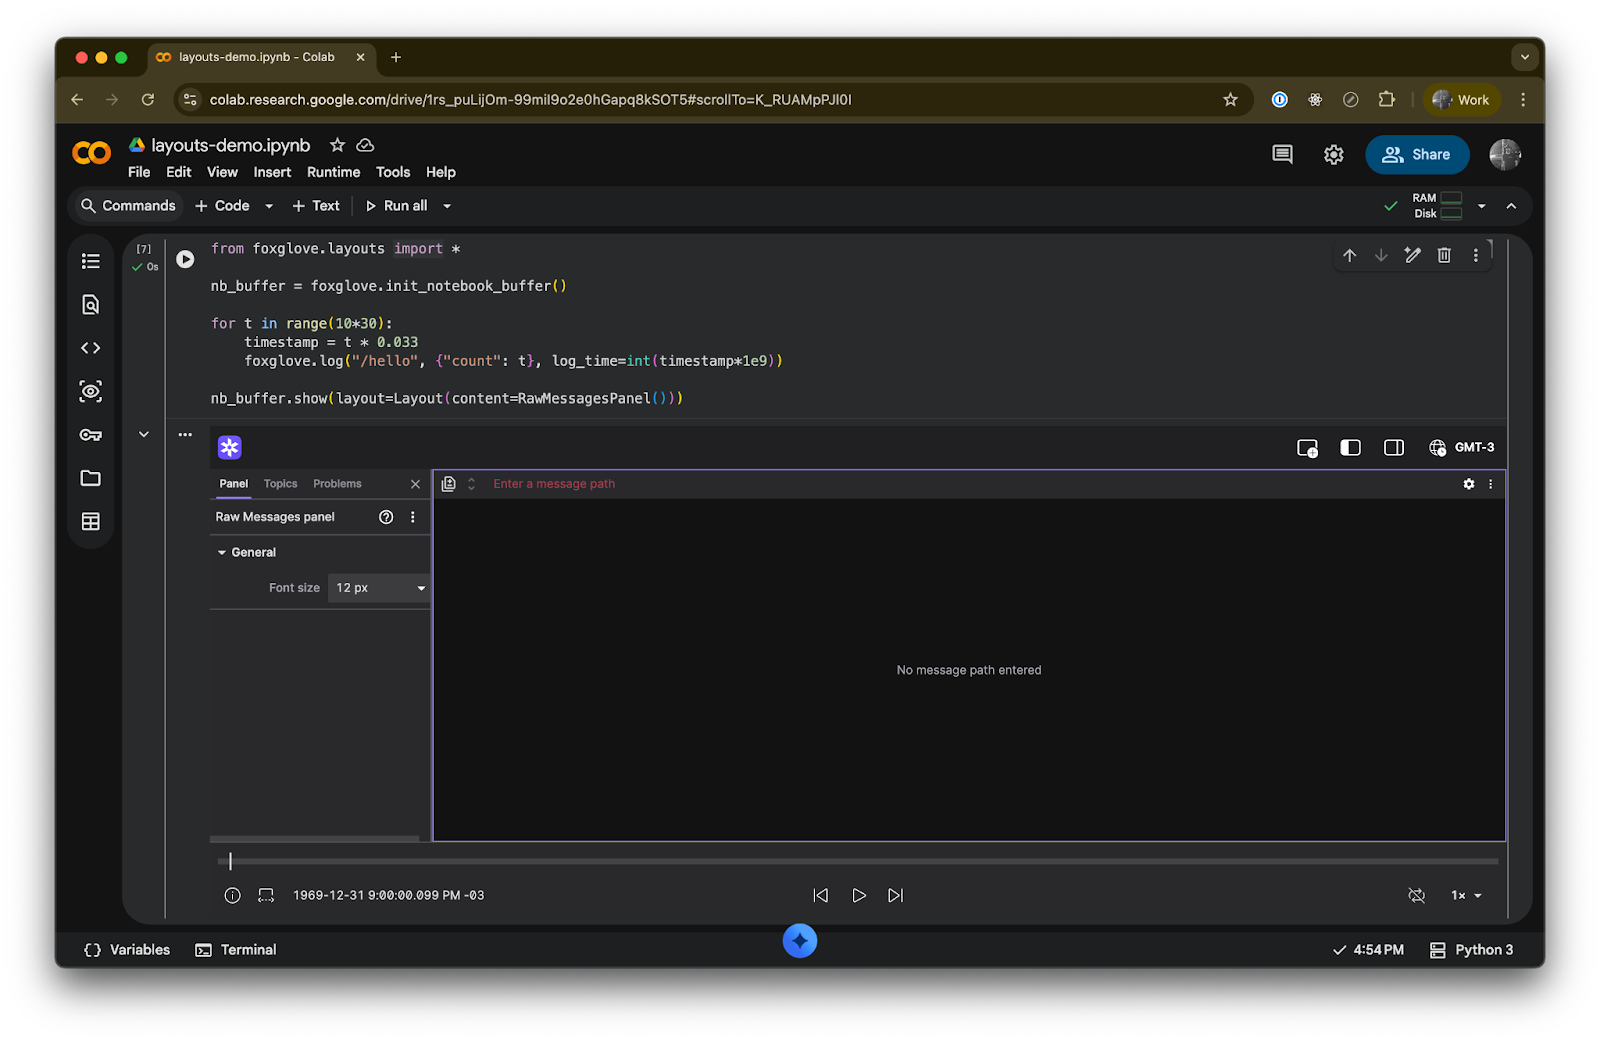
Arranging panels with splits
Use SplitContainer to arrange panels side by side (in a row) or stacked vertically (in a column). Each SplitItem specifies the content and what proportion of space it should occupy.
from foxglove.layouts import (
Layout,
SplitContainer,
SplitItem,
ThreeDeePanel,
PlotPanel,
PlotConfig,
PlotSeries,
ImagePanel,
ImageConfig,
ImageModeConfig,
)
layout = Layout(
content=SplitContainer(
direction="row",
items=[
# 3D view on the left, taking up 2/3 of the width
SplitItem(
proportion=2,
content=ThreeDeePanel(),
),
# Right column with image and plot stacked vertically
SplitItem(
proportion=1,
content=SplitContainer(
direction="column",
items=[
SplitItem(
content=ImagePanel(
config=ImageConfig(
image_mode=ImageModeConfig(
image_topic="/camera/rgb"
)
)
),
),
SplitItem(
content=PlotPanel(
config=PlotConfig(
paths=[
PlotSeries(value="/velocity.x", label="vx"),
PlotSeries(value="/velocity.y", label="vy"),
]
)
),
),
],
),
),
],
)
)
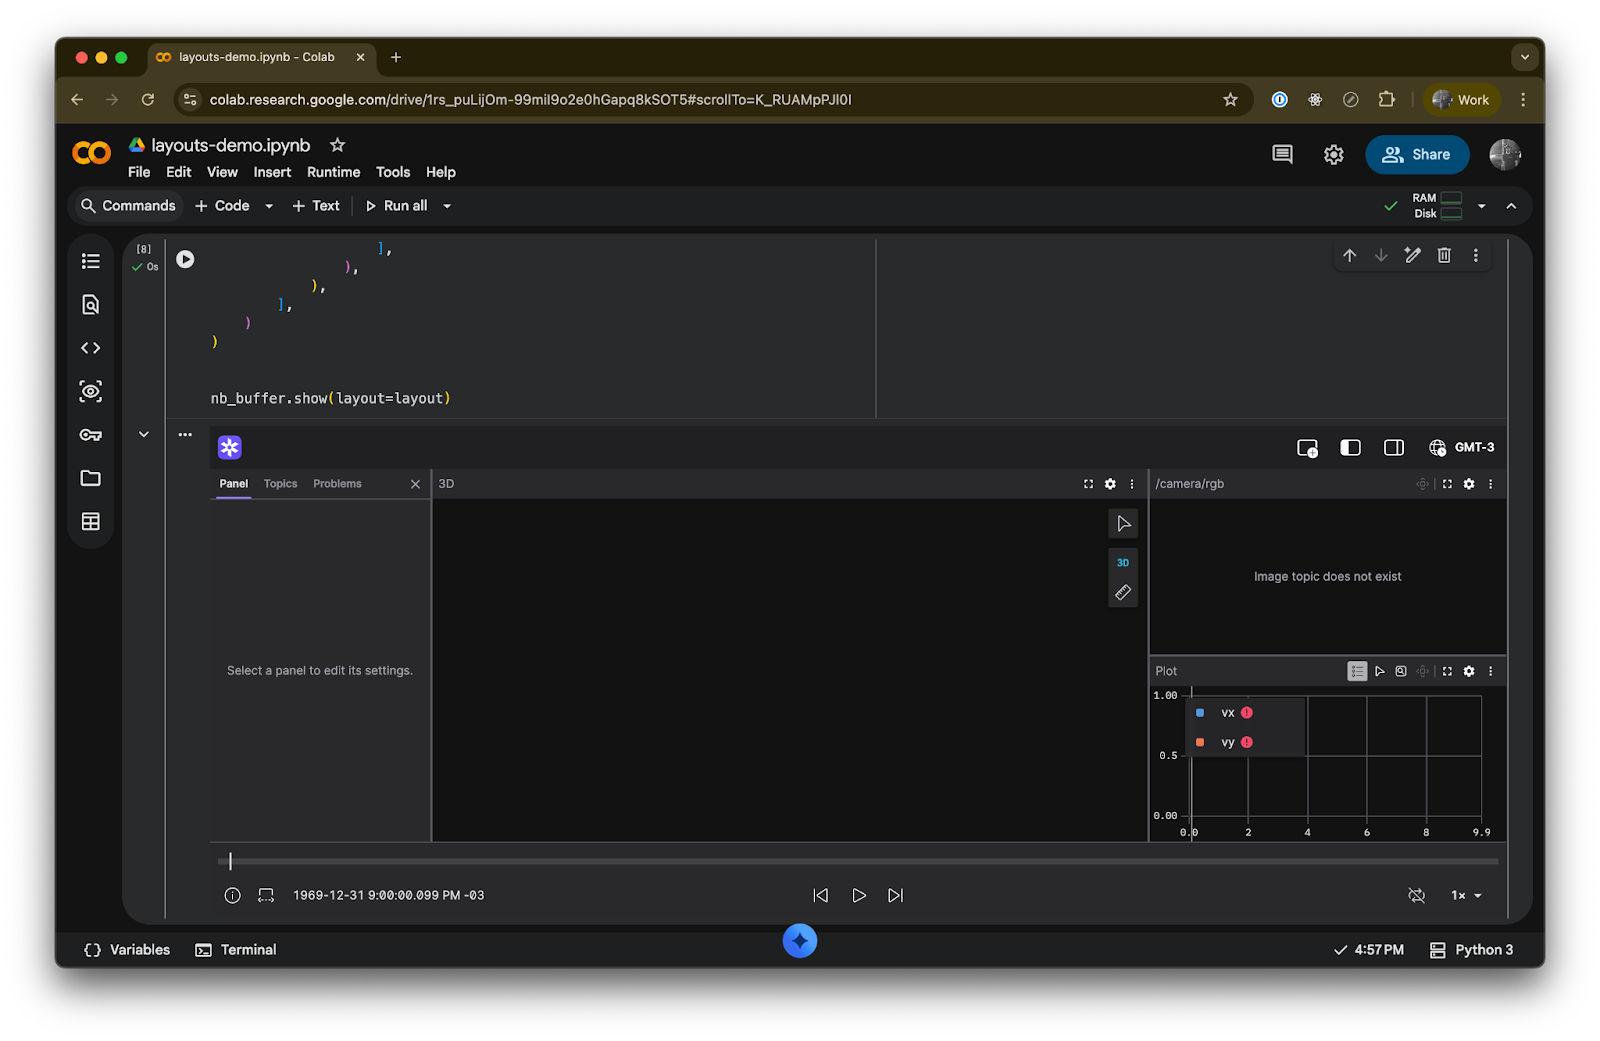
nb_buffer.show(layout=layout)This produces a layout with a 3D panel on the left taking up two-thirds of the width, and a vertically-split right column with a camera image on top and a velocity plot on the bottom.
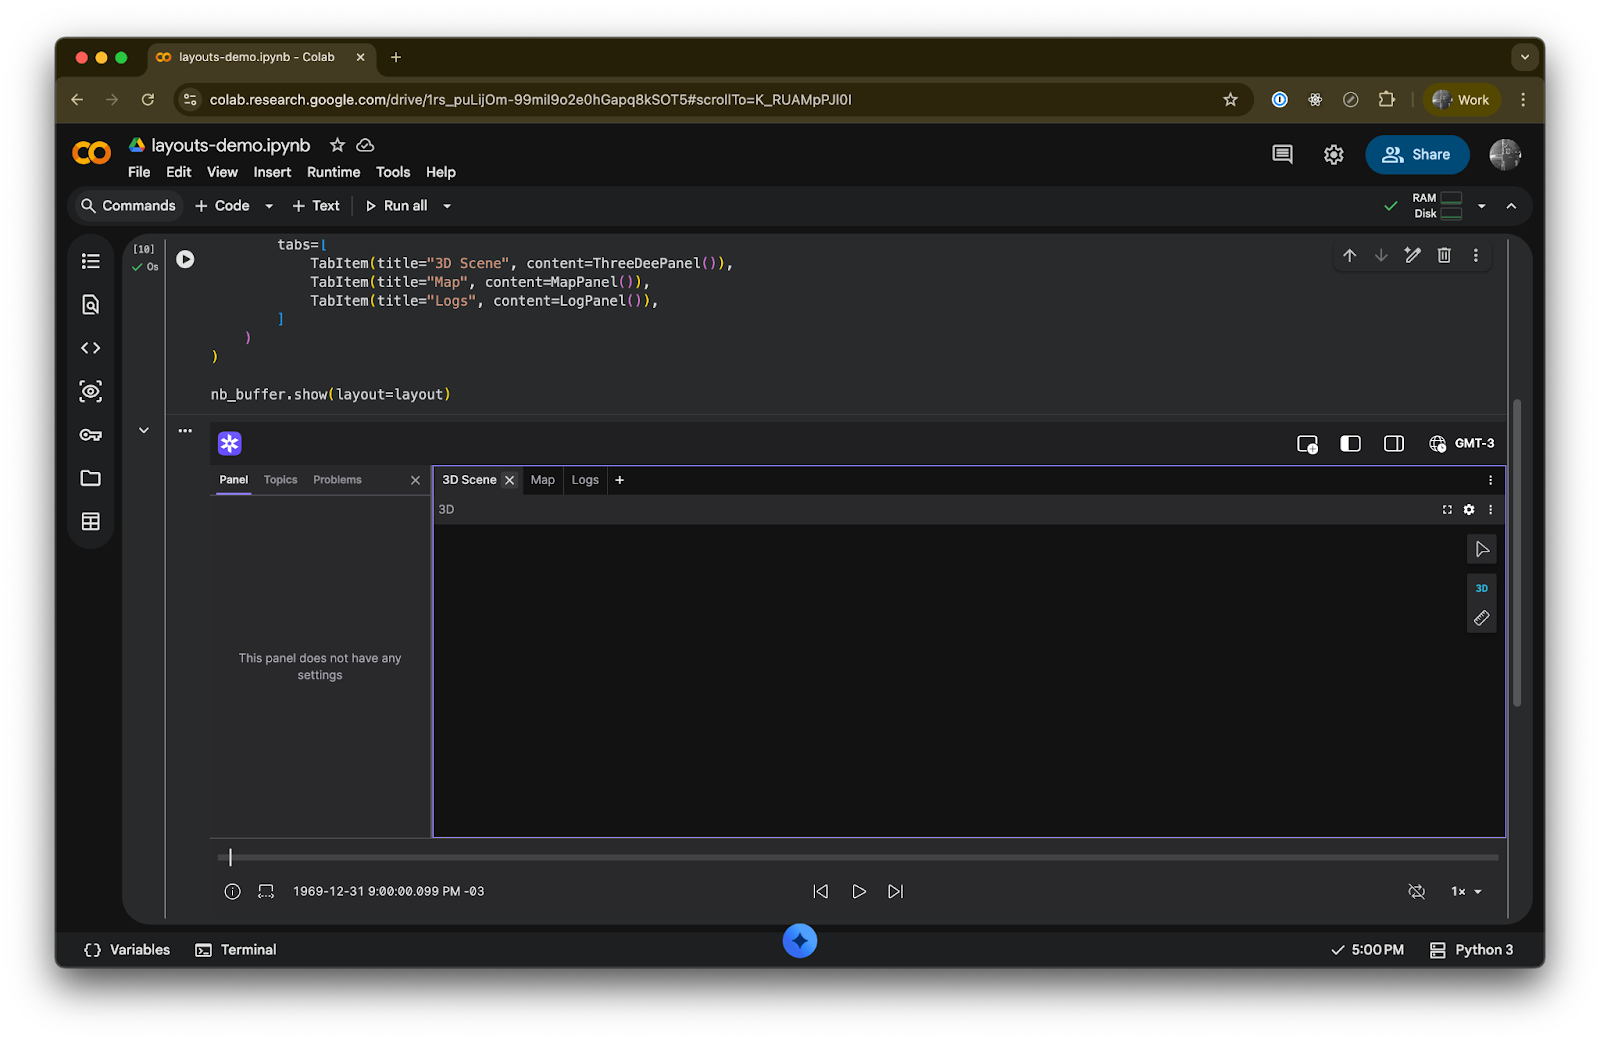
Tabs for organizing related views
TabContainer lets you group panels into tabs, which is useful when you have many views but limited screen space:
from foxglove.layouts import (
    Layout,
    TabContainer,
    TabItem,
    ThreeDeePanel,
    MapPanel,
    LogPanel,
)

layout = Layout(
    content=TabContainer(
        tabs=[
            TabItem(title="3D Scene", content=ThreeDeePanel()),
            TabItem(title="Map", content=MapPanel()),
            TabItem(title="Logs", content=LogPanel()),
        ]
    )
)
Data-dependent layouts
One of the most powerful aspects of programmatic layouts is the ability to generate panel configurations based on your data. For example, if you’re logging a variable number of sensor topics, you can create a Plot series for each one automatically:
from foxglove.layouts import Layout, PlotPanel, PlotConfig, PlotSeries

# These topics might vary from experiment to experiment
sensor_topics = ["/sensor/temperature", "/sensor/pressure", "/sensor/humidity"]

layout = Layout(
    content=PlotPanel(
        config=PlotConfig(
            paths=[
                PlotSeries(value=topic, label=topic.split("/")[-1])
                for topic in sensor_topics
            ]
        )
    )
)

nb_buffer.show(layout=layout)
Composing layout fragments
Since layouts are just Python objects, you can write functions that return layout fragments and compose them together:
from foxglove.layouts import (
    SplitContainer,
    SplitItem,
    PlotPanel,
    PlotConfig,
    PlotSeries,
    ThreeDeePanel,
    ThreeDeeConfig,
    ImagePanel,
    ImageConfig,
    ImageModeConfig,
    Content,
)


def make_camera_panel(topic: str) -> ImagePanel:
    return ImagePanel(
        config=ImageConfig(
            image_mode=ImageModeConfig(image_topic=topic)
        )
    )


def make_plot_for_topics(topics: list[str]) -> PlotPanel:
    return PlotPanel(
        config=PlotConfig(
            paths=[
                PlotSeries(value=t, label=t.split("/")[-1])
                for t in topics
            ]
        )
    )


def robot_debug_layout(
    camera_topic: str,
    plot_topics: list[str],
    follow_frame: str = "base_link",
) -> Content:
    return SplitContainer(
        direction="row",
        items=[
            SplitItem(
                proportion=2,
                content=ThreeDeePanel(
                    config=ThreeDeeConfig(follow_tf=follow_frame)
                ),
            ),
            SplitItem(
                proportion=1,
                content=SplitContainer(
                    direction="column",
                    items=[
                        SplitItem(content=make_camera_panel(camera_topic)),
                        SplitItem(content=make_plot_for_topics(plot_topics)),
                    ],
                ),
            ),
        ],
    )
Now you can call robot_debug_layout() with different parameters for each experiment and get a tailored visualization every time — no manual layout editing required.
Available panels
The layout API includes typed classes for all of Foxglove’s built-in panels:
Panel
Class
Description
3D
ThreeDeePanel
Display markers, meshes, URDFs, and more in a 3D scene
Image
ImagePanel
Display annotated camera images and video
Plot
PlotPanel
Plot numerical values over time or other values
State Transitions
StateTransitionsPanel
Track when values change over time
Raw Messages
RawMessagesPanel
Inspect topic messages
Log
LogPanel
Display logs by node and severity level
Map
MapPanel
Display GPS points on a map
Indicator
IndicatorPanel
Display a colored indicator based on a threshold value
Gauge
GaugePanel
Display a colored gauge based on a continuous value
Markdown
MarkdownPanel
Write documentation and notes in Markdown
Table
TablePanel
Display topic messages in a tabular format
Diagnostics Summary
DiagnosticsSummaryPanel
Display a summary of ROS DiagnosticArray messages
Diagnostics Detail
DiagnosticsDetailPanel
Display detailed ROS DiagnosticArray messages
Teleop
TeleopPanel
Teleoperate a robot over a live connection
Publish
PublishPanel
Publish messages to the data source
Service Call
ServiceCallPanel
Call a service and view the result
Audio
AudioPanel
Play audio streams
User Scripts
UserScriptsPanel
Write custom data transformations in TypeScript
Parameters
ParametersPanel
Read and set parameters for a data source
Variable Slider
VariableSliderPanel
Update numerical variable values
Data Source Info
DataSourceInfoPanel
View details for the current data source
Topic Graph
TopicGraphPanel
Display a graph of active nodes, topics, and services
Transform Tree
TransformTreePanel
Display the transform tree
Each panel class has a typed config parameter, so your editor’s autocomplete and type checking will guide you through the available options.
For panels from custom extensions or any panel type not yet covered by a dedicated class, you can use the generic Panel class:
from foxglove.layouts import Panel

my_panel = Panel(
    panel_type="MyCustomPanel",
    version=1,
    config={"customSetting": True},
)
Stay tuned
We’re excited about the workflows this unlocks—from fully reproducible experiment notebooks to layout libraries shared across teams. We’ll continue expanding the layout API as we add new panel types and configuration options.
Check out the layout API documentation and the Python SDK docs for the full reference.
You can also join our Discord community or follow us on X and LinkedIn to stay up-to-date on all Foxglove news and releases.