Opening a Velodyne LIDAR Connection
Calibrate your LIDAR sensors with Foxglove

When we talk about Foxglove for visualizing your robotics data, we often envision troubleshooting a fully fledged robot – maybe something with a motor, wheels or rotating arms, and a variety of cameras, radar, and LIDAR sensors.
While this may be the case for many Foxglove users, Foxglove can also help you visualize data earlier in your development process – long before you have a working robotics stack or an assembled robot.
To demonstrate this, let’s cover one of our lesser-known data sources in Foxglove – the Velodyne LIDAR connection.
What is Velodyne LIDAR?
As a San Jose-based LIDAR technology company, Velodyne LIDAR develops sensors for the field’s leading robotics companies, for applications as wide-ranging as autonomous vehicles, mobile mapping, and delivery drones. These state-of-the-art sensors are directly responsible for bringing robotics technology into more visible arenas of our lives. Industry giants like NVIDIA, Clearpath Robotics, and Postmates are leveraging LIDAR technology to monitor traffic, streamline construction, and automate food delivery.
As ubiquitous as Velodyne LIDAR technology has become, it’s no surprise that many Foxglove users are using these sensors on their robots to collect spatial data. If you want to get visual feedback on your sensor data before troubleshooting the rest of your robot, you can use Foxglove to calibrate your hardware – even before you have a properly functioning robotics stack.
Connecting to your Velodyne hardware
To visualize data coming into your Velodyne LIDAR sensor, you’ll first need to connect your sensor to a local network with an Ethernet cable (often included in your Velodyne shipment). I’ll be using the Puck sensor, but Foxglove supports visualizing data from any Velodyne LIDAR sensor.
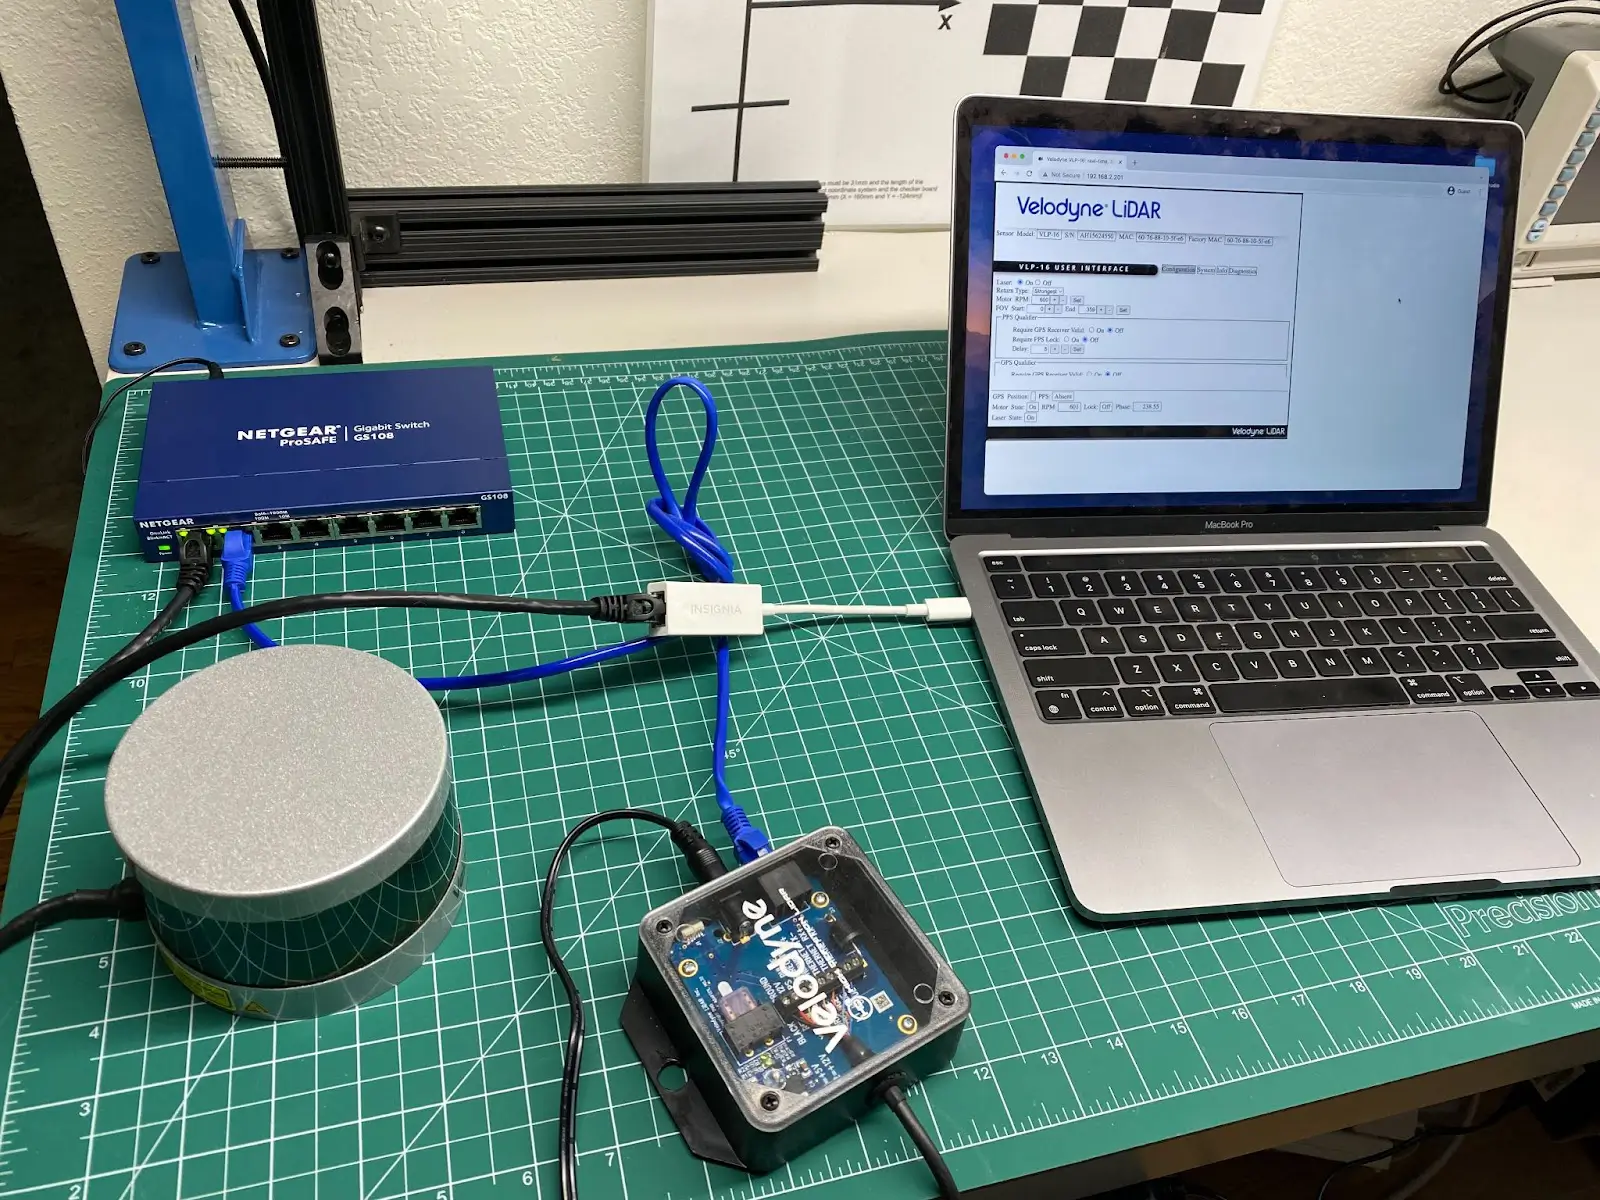
You can confirm everything is connected properly by visiting the Velodyne IP address in a browser (in our case, 192.168.2.201). From here, you can use the available web GUI to make sure your computer is on the same subnet as the Velodyne sensor.
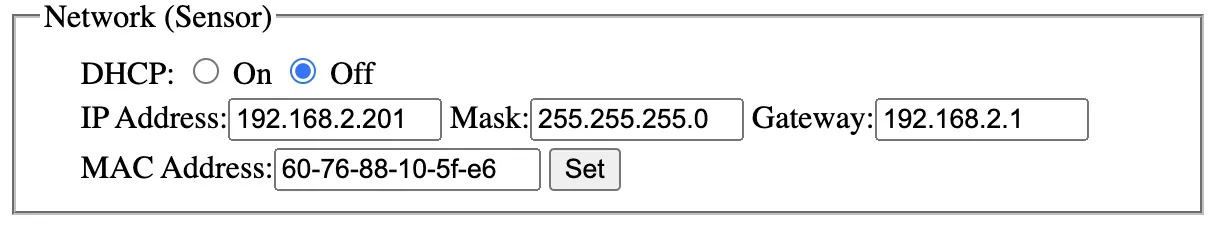
The Velodyne IP address may be statically assigned or assigned from DHCP, depending on the sensor’s configuration. Consult the Velodyne manual for more information on the networking setup.
Visualizing your LIDAR data in Foxglove
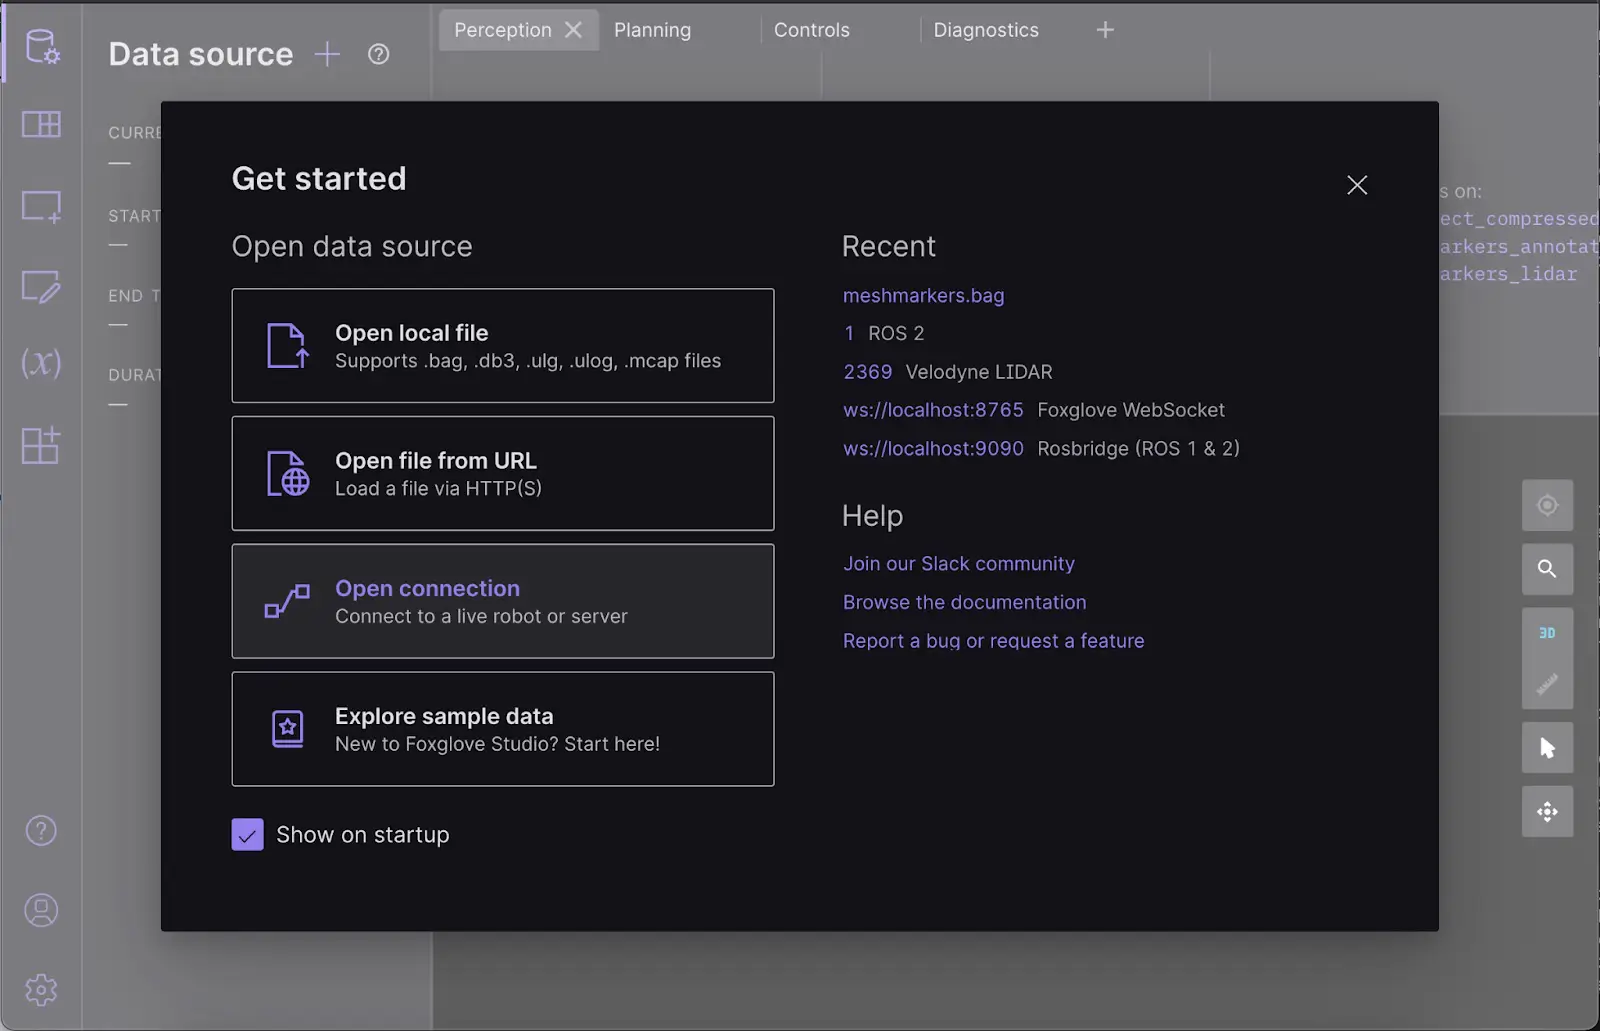
The sensor communicates by broadcasting UDP packets to 255.255.255.255 on port 2369 by default. To visualize this data, you’ll need to open the Foxglove desktop app and “Open connection”:
From there, select the Velodyne LIDAR option. You’ll be prompted for a UDP port – unless you’ve previously changed the sensor’s UDP port yourself, you can leave the default value at 2369.
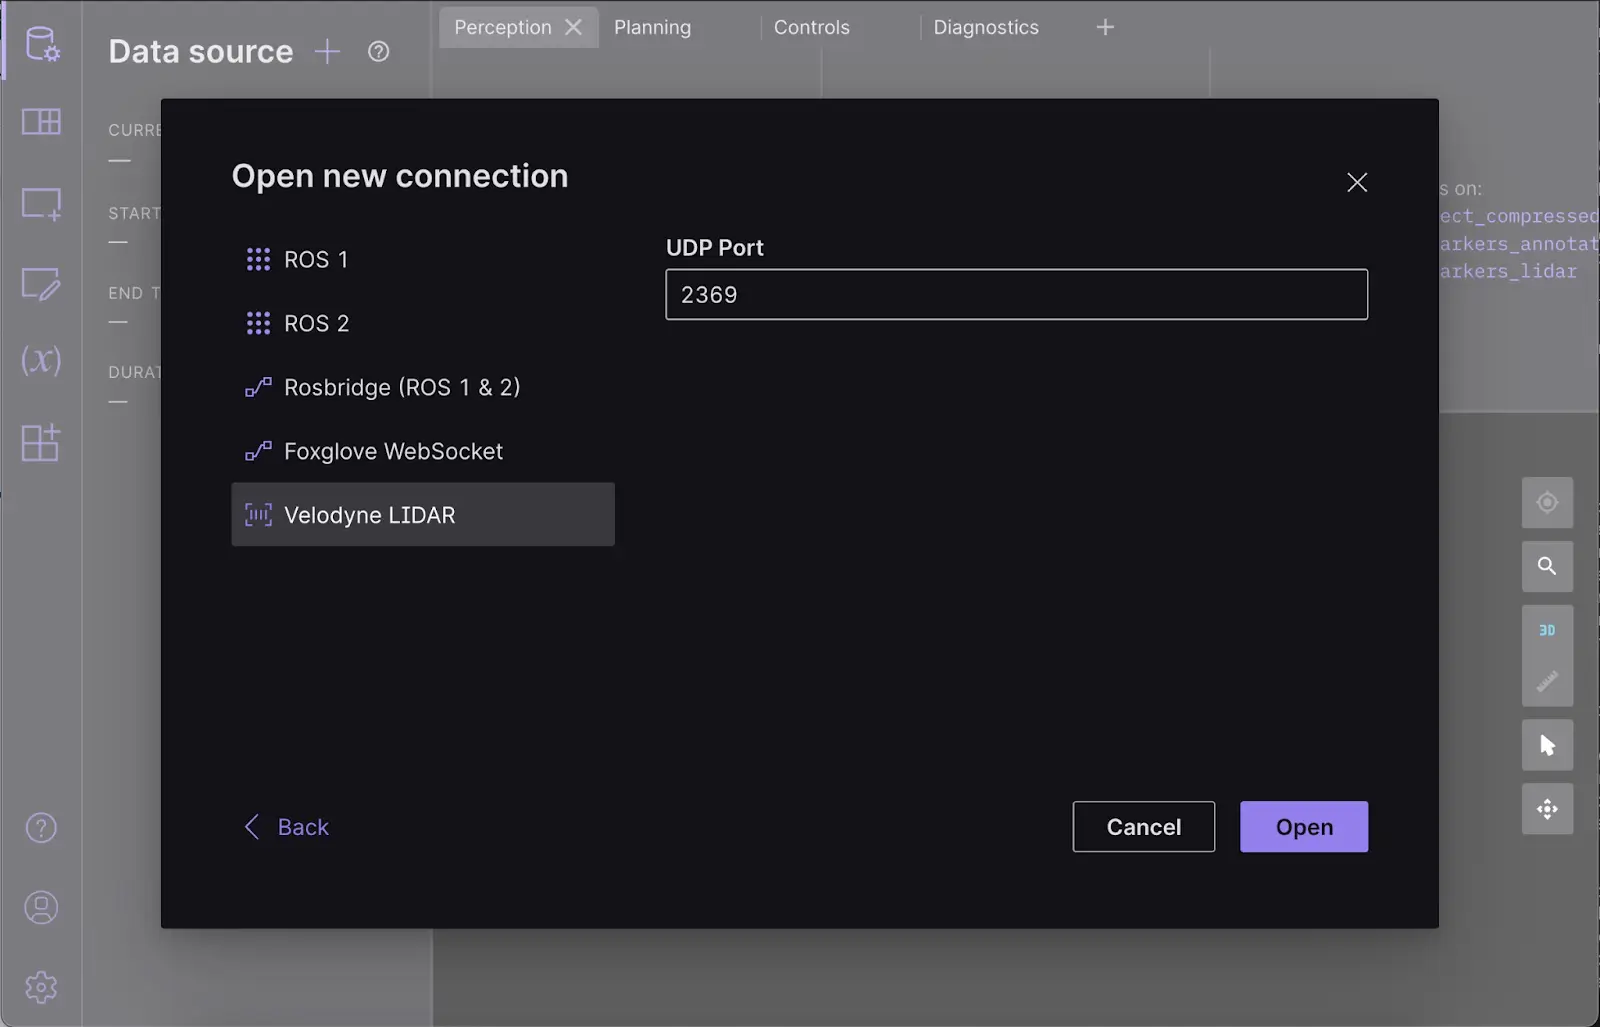
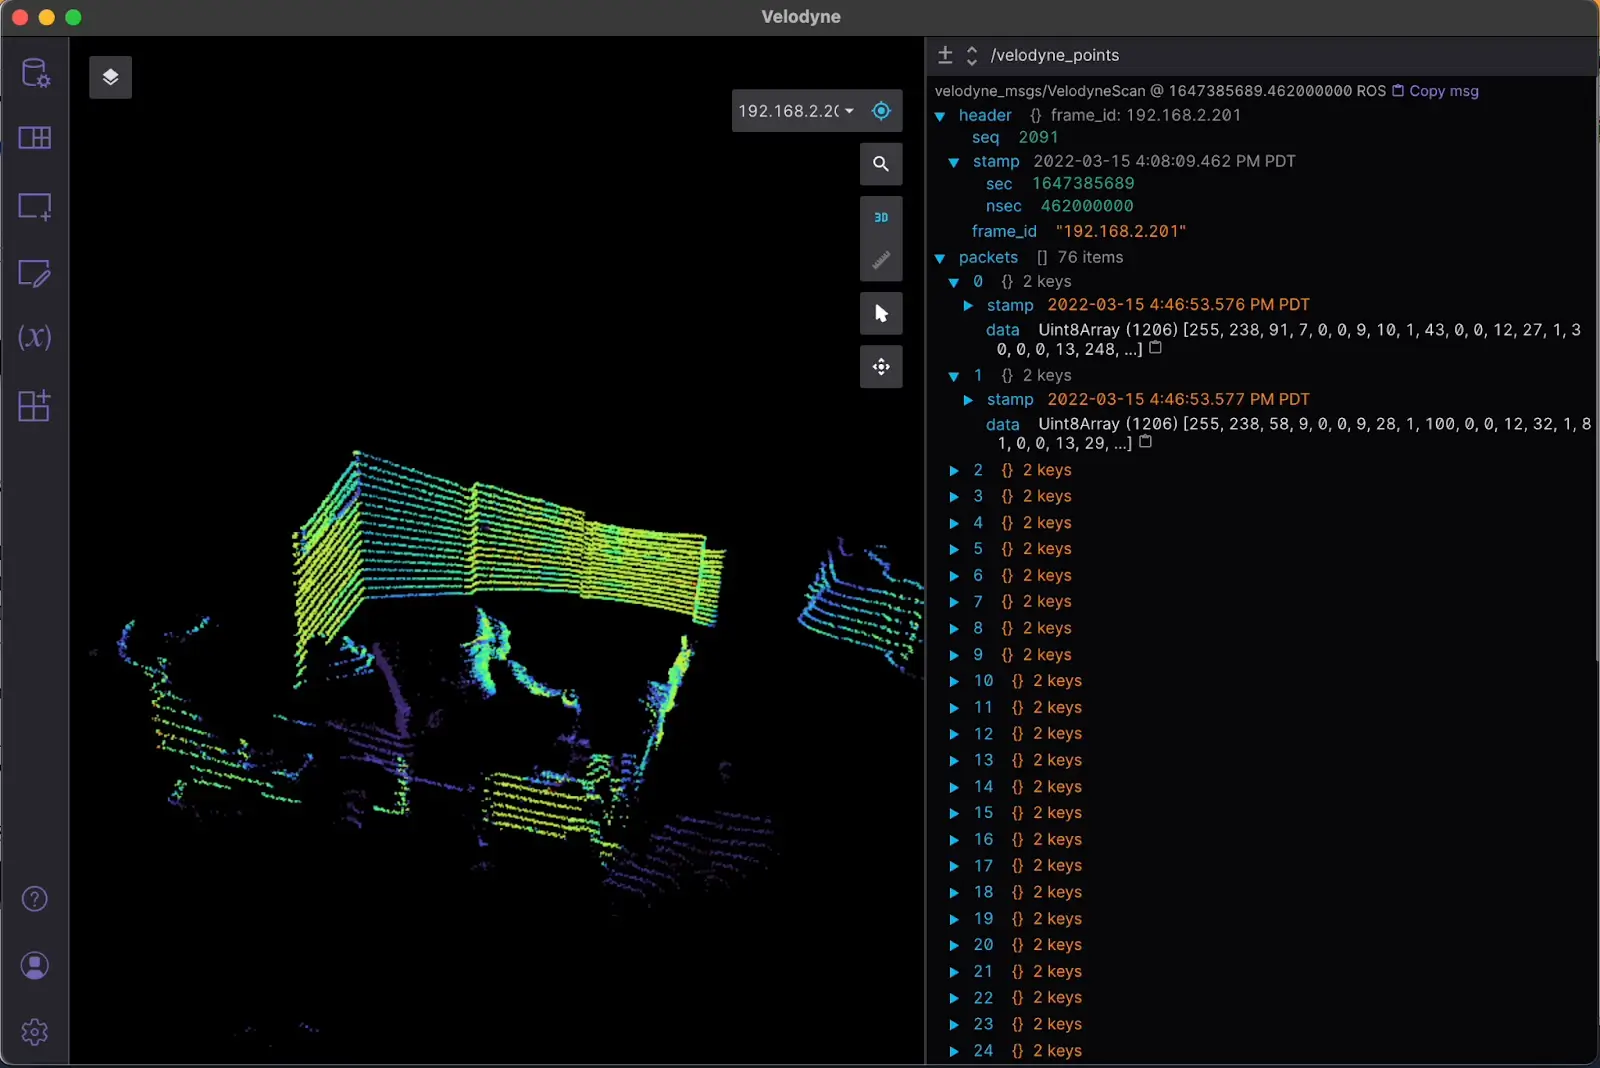
Click “Open”. You shouldn’t see any changes yet. Add a 3D panel to your layout, and then open the topic picker to toggle on your LIDAR scan topic /velodyne_points.
From there, you should start to see your sensor data displayed in your 3D panel! Move your sensor around to view different parts of your environment – see if you can identify what LIDAR returns correspond to what real-life obstacles.
Visualizing support for every stage of development
Whether they’re making cities smarter, people safer, or workplaces more efficient, Velodyne LIDAR’s state-of-the-art sensors have set the industry standard for collecting rich spatial data. If you’ve decided to integrate them into your own robotics build, we want you to be able to use Foxglove to visualize their data.
Foxglove provides you with the building blocks to compose your own tools – no matter the workflow you’re tackling, the amount of data you have, or the stage of development you’re in. If you have a mature robotics build with multiple actuators, sensors, and other bells and whistles, you can build a complex layout to debug each level of your robotics stack. But if your robot is currently nothing more than a sensor mounted on some wheels, Foxglove can still help you get started. Open up that Velodyne LIDAR connection, and see the world as your robot does.