Real-time Isaac Sim data visualization using Foxglove.
Visualizing NVIDIA Isaac Sim data using Foxglove’s custom extension.

Simulation eliminates the need for physical hardware, enabling robotics developers to test algorithms and prototypes in a virtual environment. In this tutorial, we’ll demonstrate how to visualize an Isaac Sim simulation in real time using Foxglove’s custom extension. The extension will appear in the Extension Manager within Isaac Sim, but behind the scenes, when you click Install, it pulls from this repository.
Many robotics engineers use NVIDIA Omniverse’s popular Isaac Sim to simulate and test robotic systems in a realistic 3D environment, enabling effective algorithm development and validation without the need for physical prototypes. While most simulation environments offer a UI to visualize the simulated “ground truth,” it’s also valuable to view the simulation from the robot’s perspective. This provides key insights into the robot’s decision-making processes and allows for closer monitoring of its interactions with the environment. That’s why we created an extension to seamlessly connect Foxglove to Isaac Sim.
This extension uses Foxglove’s WebSocket Protocol to seamlessly link any Isaac Sim project to a Foxglove visualization interface. It automatically detects all cameras, IMUs, and articulations in the simulation stage, making their data available in Foxglove, along with the complete Transform Tree. To prevent excessive data flow, sensors are only queried when toggled on by the user in Foxglove.
Setting up
Inside Isaac Sim, open the extension manager under Window > Extensions:
- In the “Third Party” tab, search for “foxglove” and click on “Foxglove Extension” (you may need to wait for the registry to load).
- The extension page should open to the right. At the top, click “Install”.
- Once this is done, simply enable the extension and you’re good to go!
Launching the extension
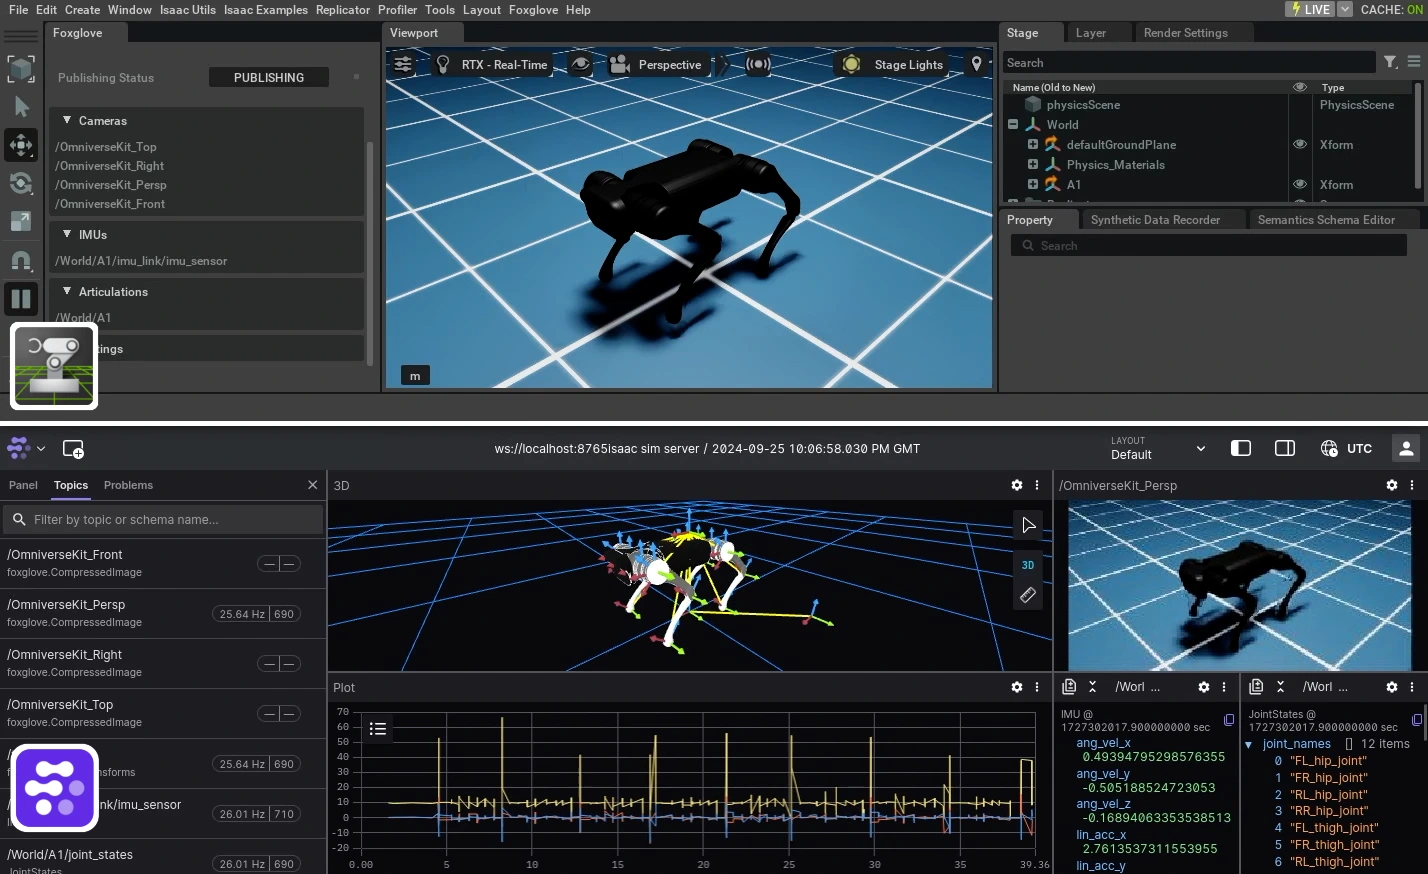
In Isaac Sim, load the project you want to visualize in Foxglove (in this example, we’re using the quadruped example found under Isaac Examples > Quadruped in the toolbar). With the Foxglove Extension enabled, click on Foxglove > Foxglove Extension in the toolbar. A new tab will open on the left side of the viewport.
This tab displays all available data streams, sorted by type. Each of these topics can be accessed from the Foxglove client (see the next section). The tab reacts dynamically to changes made in the Isaac Sim stage, automatically detecting when new sensors are added or removed.
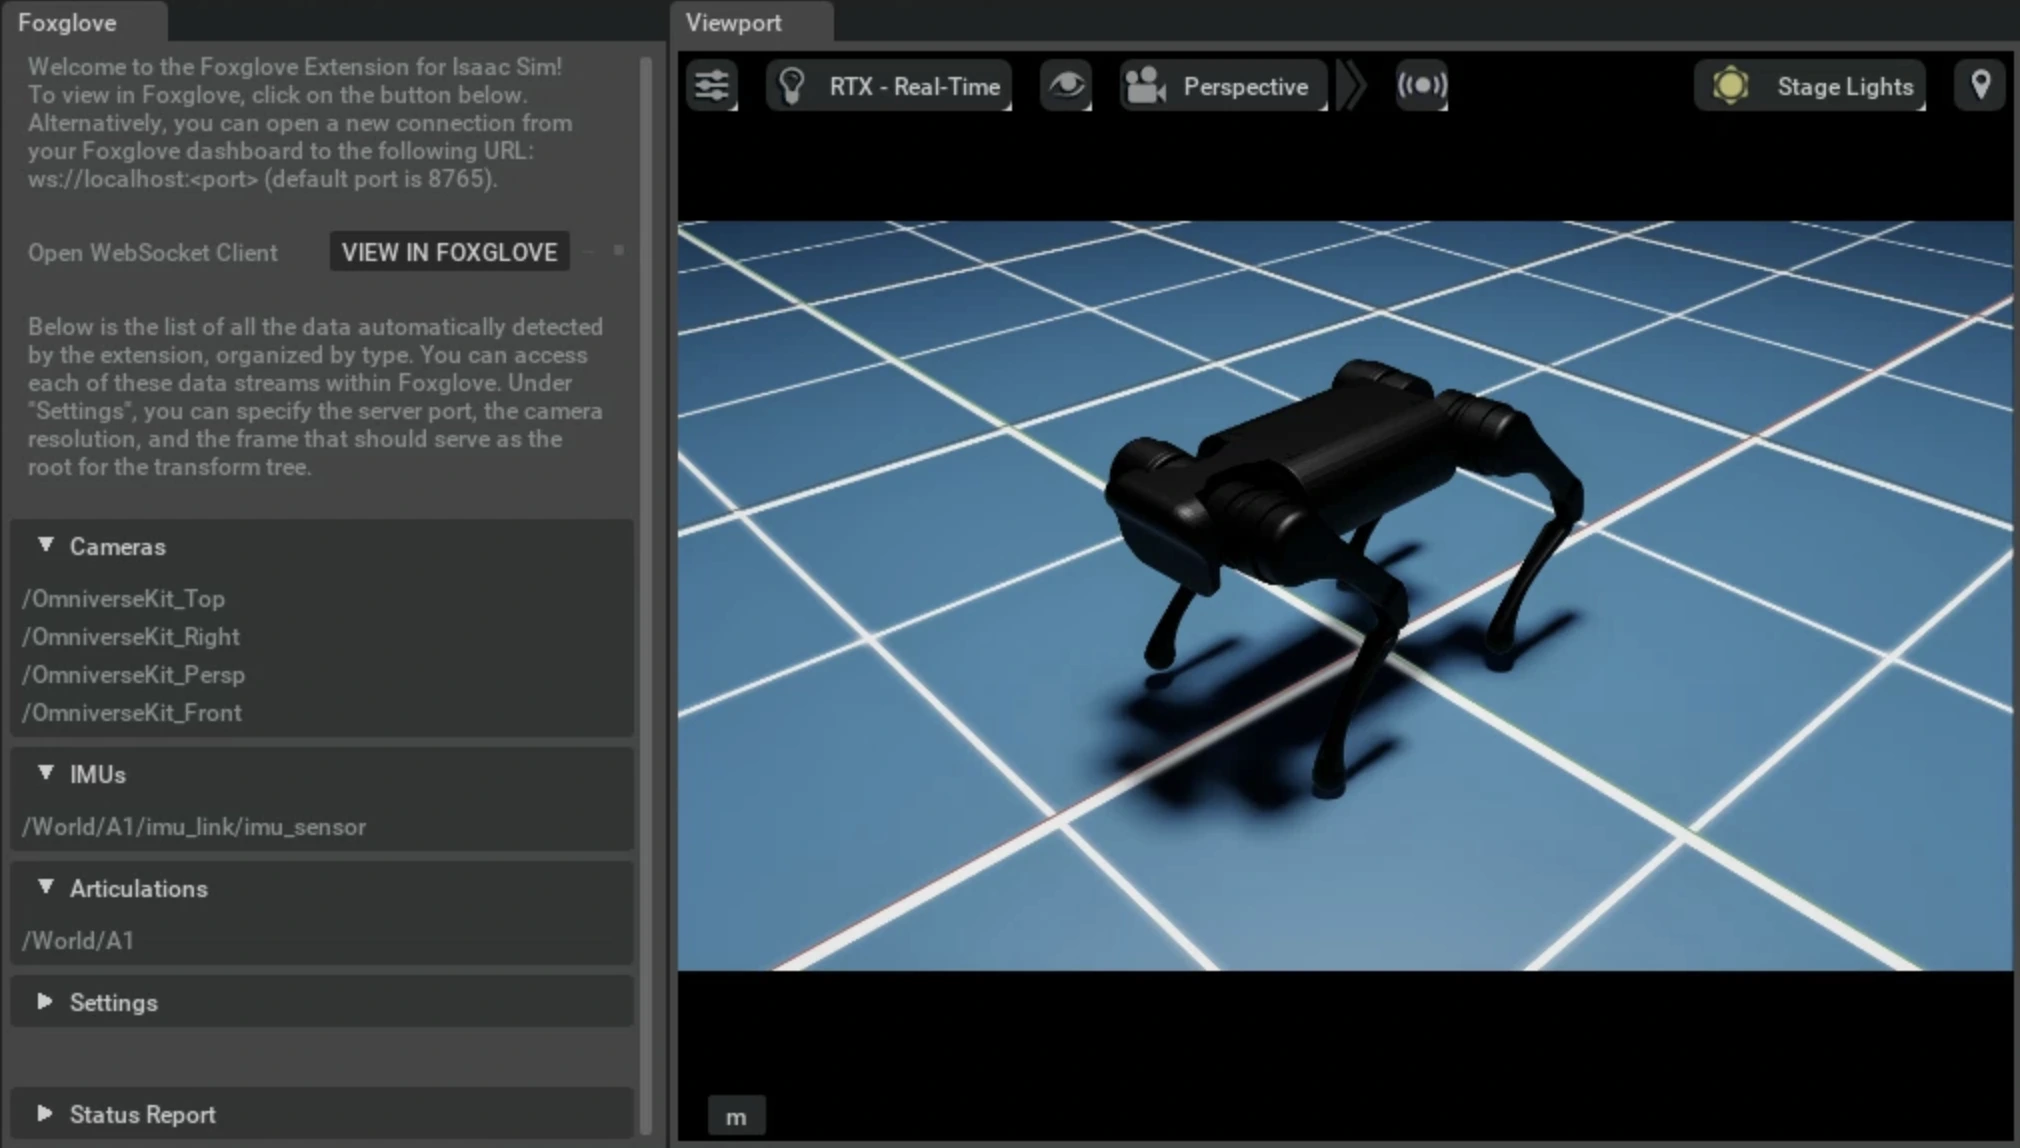
Under the “Settings” collapsable menu, you can optionally specify:
- The Port that the Foxglove server should use
- The Camera Resolution for the image streams (keep in mind that increasing the resolution will slow down the simulation)
- The Root Frame for the TF Tree
💡 The Foxglove server starts automatically when the extension tab is opened. It will remain open until the extension tab is closed.
Visualizing the data
With the Foxglove Extension tab open, you can now visualize the data inside Foxglove. Simply click on VIEW IN FOXGLOVE to open the WebSocket client directly in your browser.
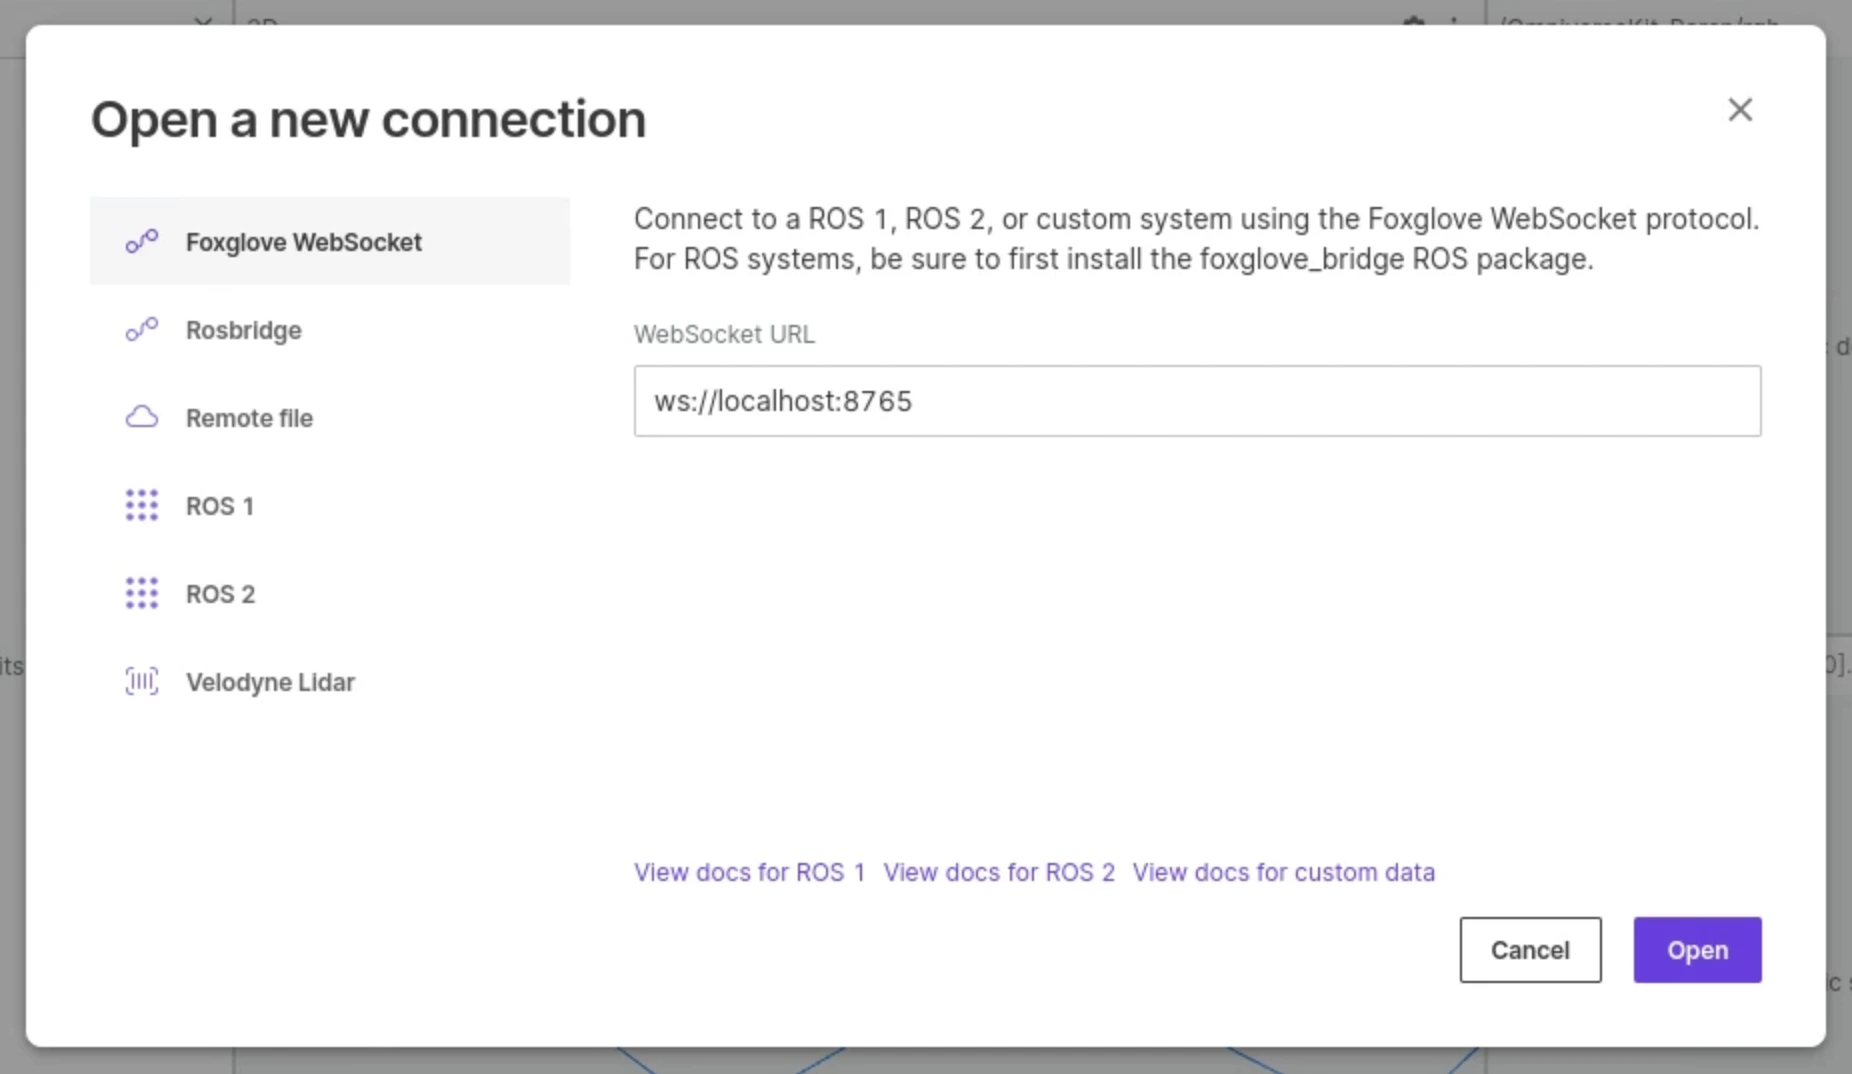
Alternatively, you can open a new connection from your Foxglove Dashboard in the desktop app or browser. In the sidebar, select Foxglove WebSocket and enter the WebSocket URL ws://localhost:<port>, replacing <port> with the value specified in Settings (8765 by default). Then, click Open.
Once you start the Isaac Sim simulation, the data will appear on the Foxglove client. From there, you can customize your layout as desired and begin visualizing!
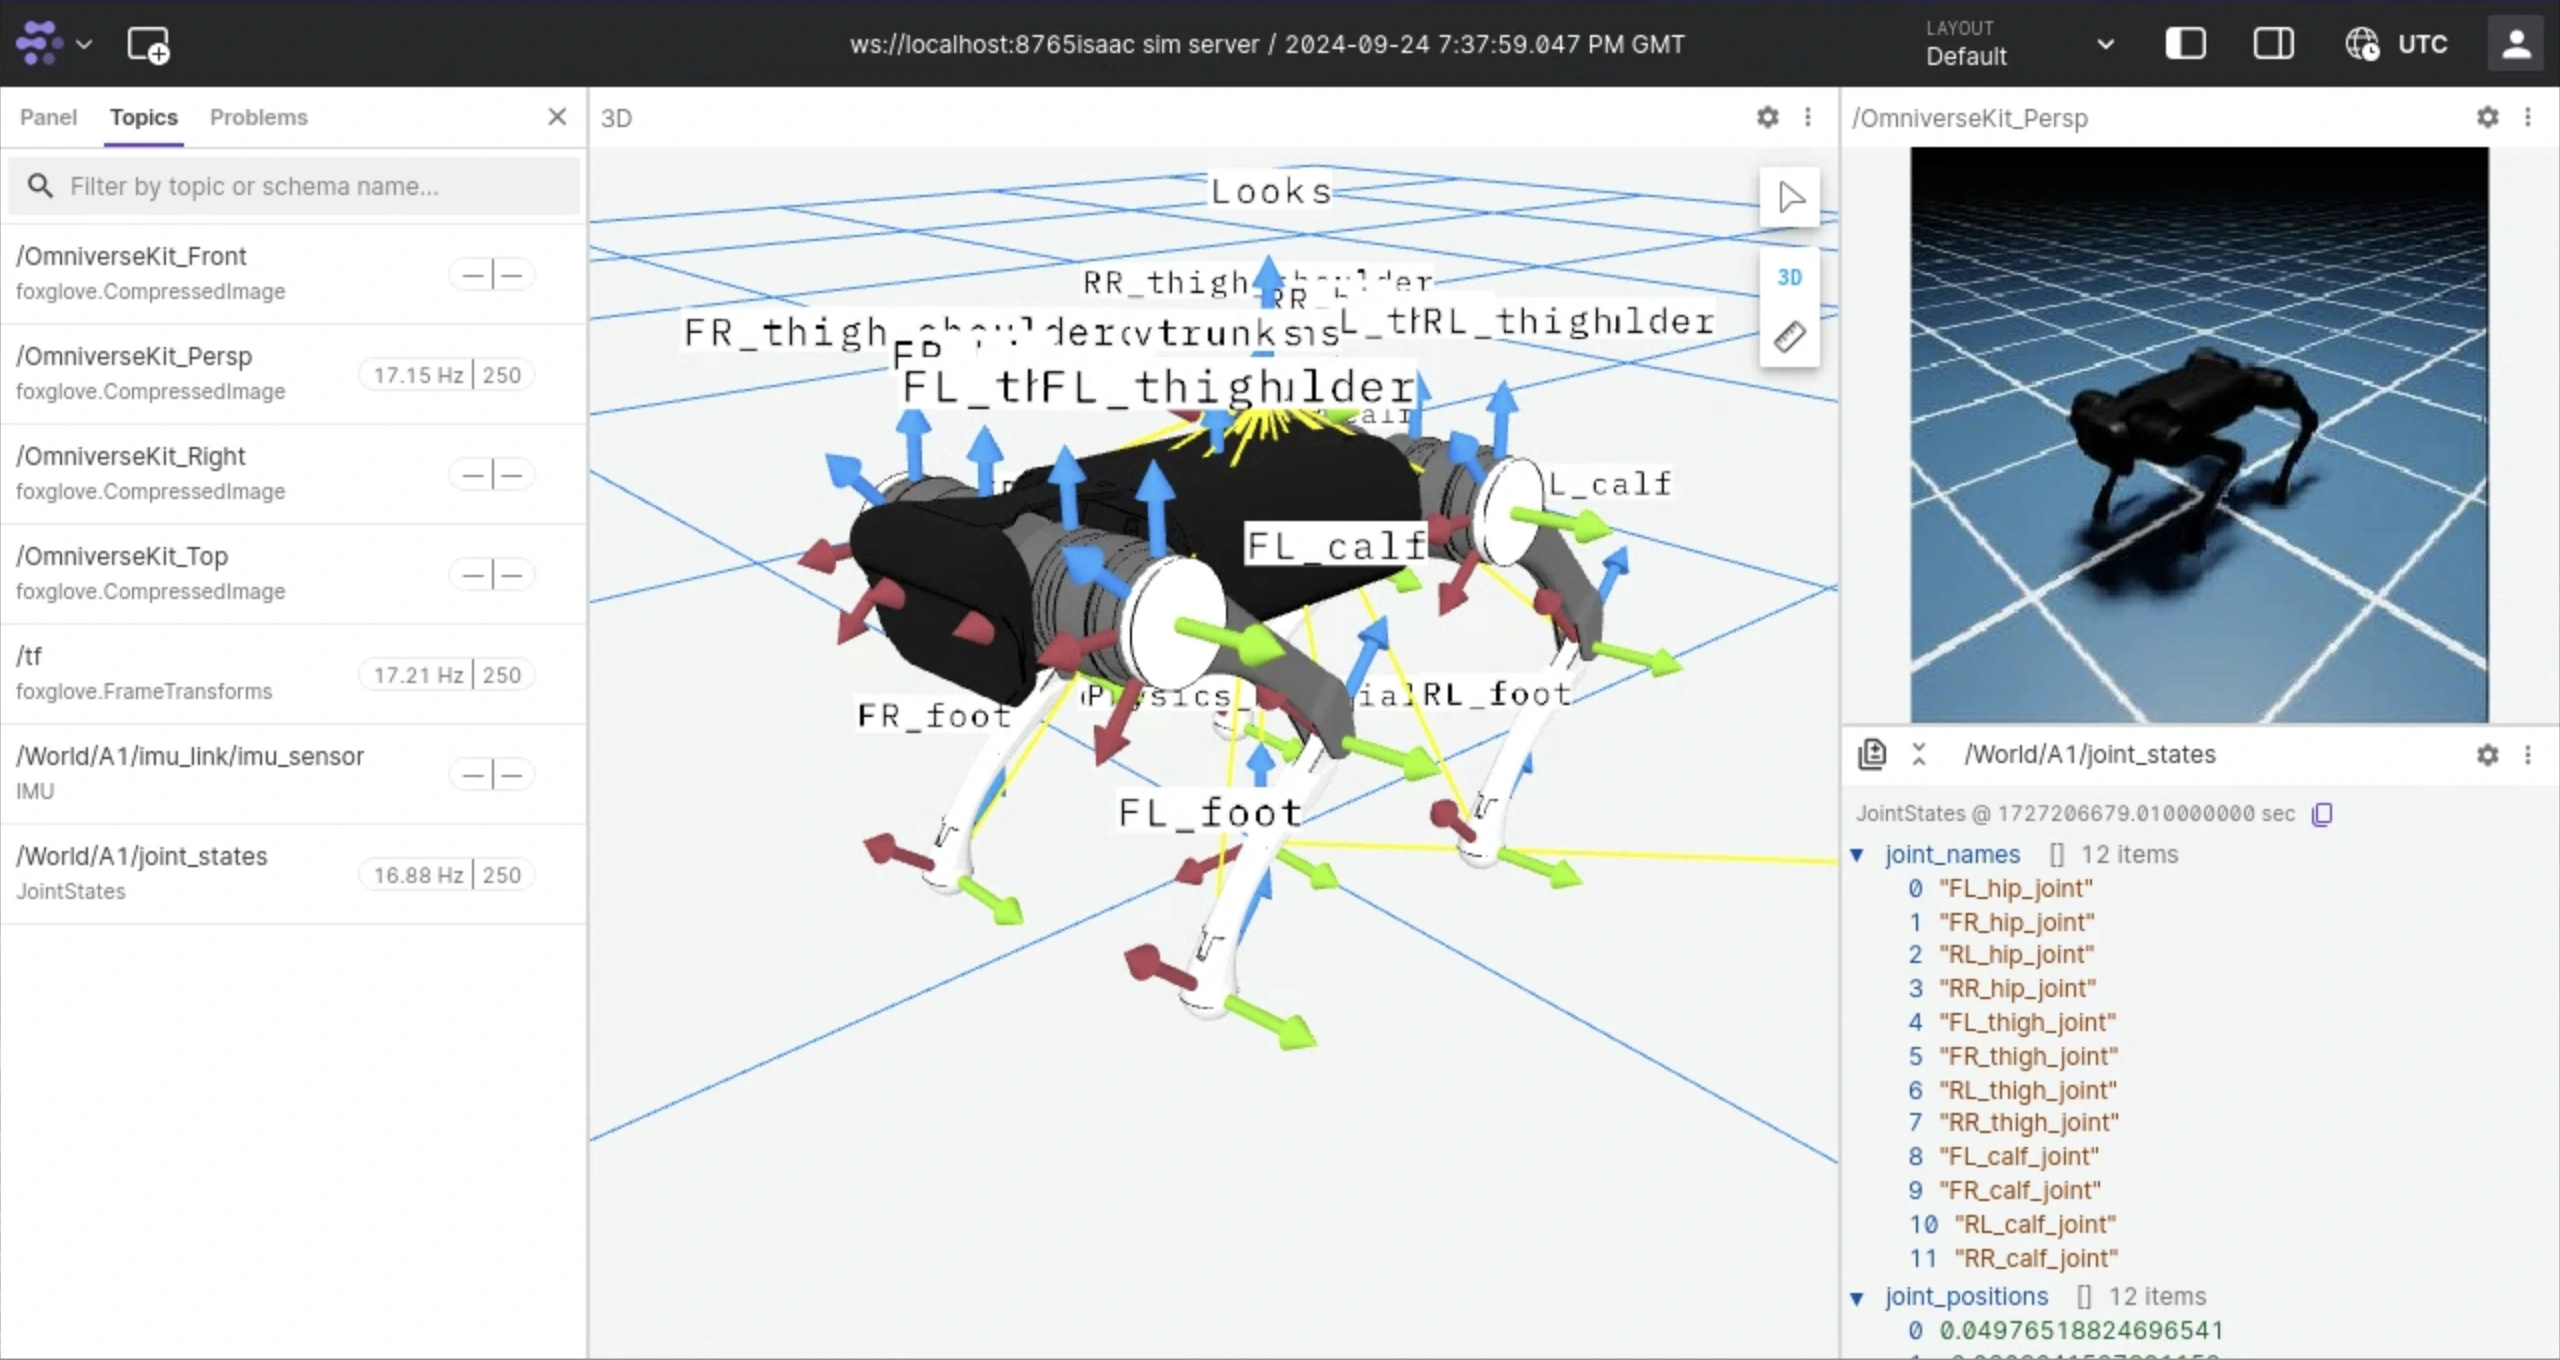
The URDF needs to be loaded manually (in this example: Unitree A1). Data is only sent to Foxglove when the simulation is playing.
How we built this
This extension uses Foxglove’s WebSocket Protocol Package and runs a server as an asyncio task alongside the simulation. Through a system of callback functions, the simulation operates in parallel, sending data to the server at each simulation step.
The extension tracks all sensors within the Isaac Sim stage, listening for add and delete events to maintain an updated list. Each sensor’s type is automatically detected, and corresponding server channels are created using a topic name derived from the sensor object’s unique path.
Channels are initialized using Protobuf or JSON schemas that correspond to the relevant data types, as seen in the linked example codes. Some schemas are available on Foxglove’s GitHub, while others are custom-written.
At each simulation step, the extension queries the sensors linked to the topics the user has subscribed to in the Foxglove client. The sensor data is then formatted according to the Protobuf and JSON schemas and sent to the Foxglove server.
We had a lot of fun with this and hope you can too. If you haven’t already explored Foxglove for all your robotics data visualization needs, sign up here and check it out!