Using ROS Diagnostics in Robotics Operations
How Foxglove's Diagnostics Panel can improve fleet uptime

When a developer hands off a robot to an operator for real-world usage, they do so with the understanding that the robot is in good working order. Over time, though, and with ongoing usage, something is bound to go wrong — perhaps a robot stops working, or is acting in an unexpected way. Operators rely on consistent (and high) uptime in their fleets, and rely on diagnostic codes to quickly understand the gravity of an issue.
In this blog, we’ll dive into the practical side of robotic diagnostics, an essential tool for keeping fleets operating smoothly, and how operators can minimize downtime among their platforms.
Debugging in scaled operations
It is crucial to have a way to communicate the status of the robot in a way that makes sense to the operator and allows them to act quickly on the information. While developers might use the terminal (a.k.a. rosout) for debugging, it is not ideal for commercial or final use — operators are often working with entire fleets and lack the time to go through the massive stream of data from multiple nodes to find the issue.
A useful user interface will not show the operator the complete diagnostic message, but rather a brief message indicating the status of the whole system and each subsystem. This accelerates the comprehension of the situation and enables the operator to take action faster.
Red light, green light
When debugging a problem in a complex system during runtime, it’s easier for the operator to read a single diagnostic message that will show quickly where the problem is. Diagnostics are the minimal information needed to understand what’s going on within the systems. Think of this as the indicators you would find in a car dashboard: blinkers, lights, oil, fuel or battery remaining.
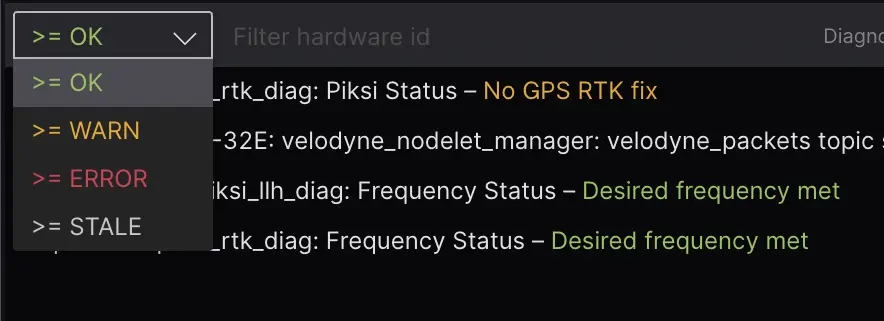
Usually diagnostics are categorized in four levels: OK, WARN, ERROR, and STALE.
OK means it’s working as expected. Hopefully, this is what you’re seeing most of the time, and means that the machine can continue running as expected.
WARN symbolizes there is something off but the system can still work — but you’d be wise to halt operations at the next chance to investigate what the trouble is.
ERROR means the system has experienced a problem and will not work as expected. Typically, it is recommended to stop the system when an error arises, as continuing to use the machine could cause irreparable harm.
STALE means that the status has not been updated because messages are not coming through.
Visualizing diagnostics in Foxglove
While a WARN or ERROR code on a robot might require intervention from the developer, that’s not always the case. Sometimes these can easily be fixed by the operator without help — for example, a code might indicate that a battery has run low, or that the robot doesn’t have a good connection.
The Diagnostics Panel in Foxglove shows diagnostics one level deeper than the three-indicator system built into the robot’s UI. This makes it easier for operators to visualize the diagnostics and get a better understanding as to whether the problem is a quick fix or requires a trip back to the manufacturer.
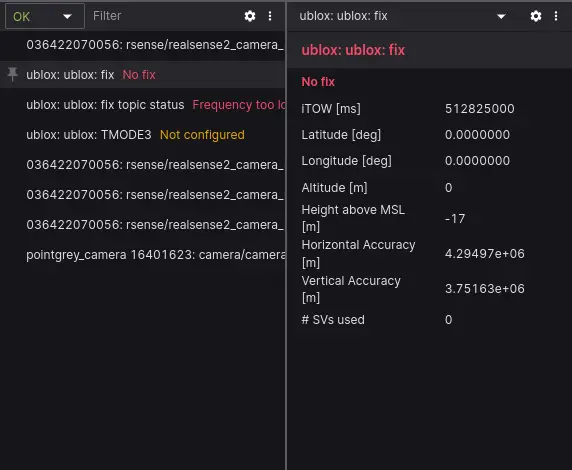
Below are examples of diagnostic messages. In the first example, we can see different levels of diagnostics — in this case, the ublox error indicates that the robot has lost connection with the satellites and needs to be relocated. Despite showing up as a severe ERROR code, this is an easy fix for the operator and doesn’t require a trip back to the developer.
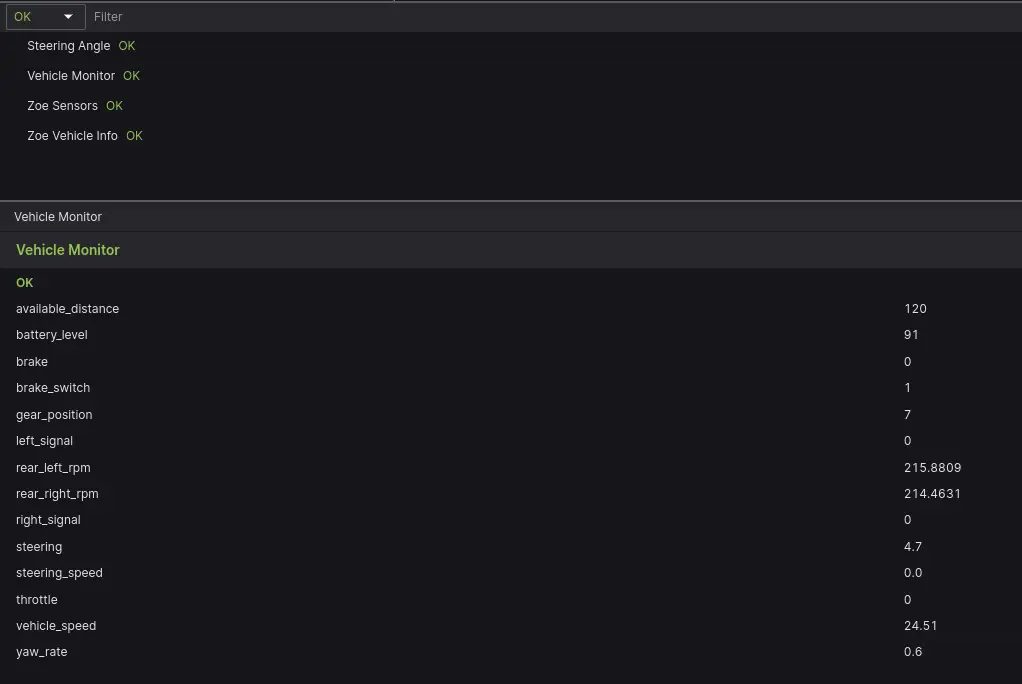
In this second example, the diagnostics report a fully operational system with no errors to be seen — ideally this is what you are seeing at all times!
Other examples of diagnostics variables that can be visualized in Foxglove include CPU load, temperatures, failures in control loops, sensor states, and watchdogs to check if systems are running.
Contrary to the native ROS rqt_robot_monitor, Foxglove contains a summary and a detailed view of the diagnostics. This helps the operator focus on the errors and warnings in a single window. On the other hand, rqt opens new windows for each subsystem, making it less intuitive to use — especially when it comes to the quick decision-making required from robotics operators.
How to use diagnostics in ROS
Visualizing diagnostics in Foxglove is easy with the Diagnostics Panel, but requires some set up to start publishing the datastream from the robot. Check out this tutorial on publishing diagnostics in ROS 1 and 2 and get started with Foxglove today!


