Visualizing Point Clouds with Custom Colors
Use Foxglove's new color modes to customize your point clouds
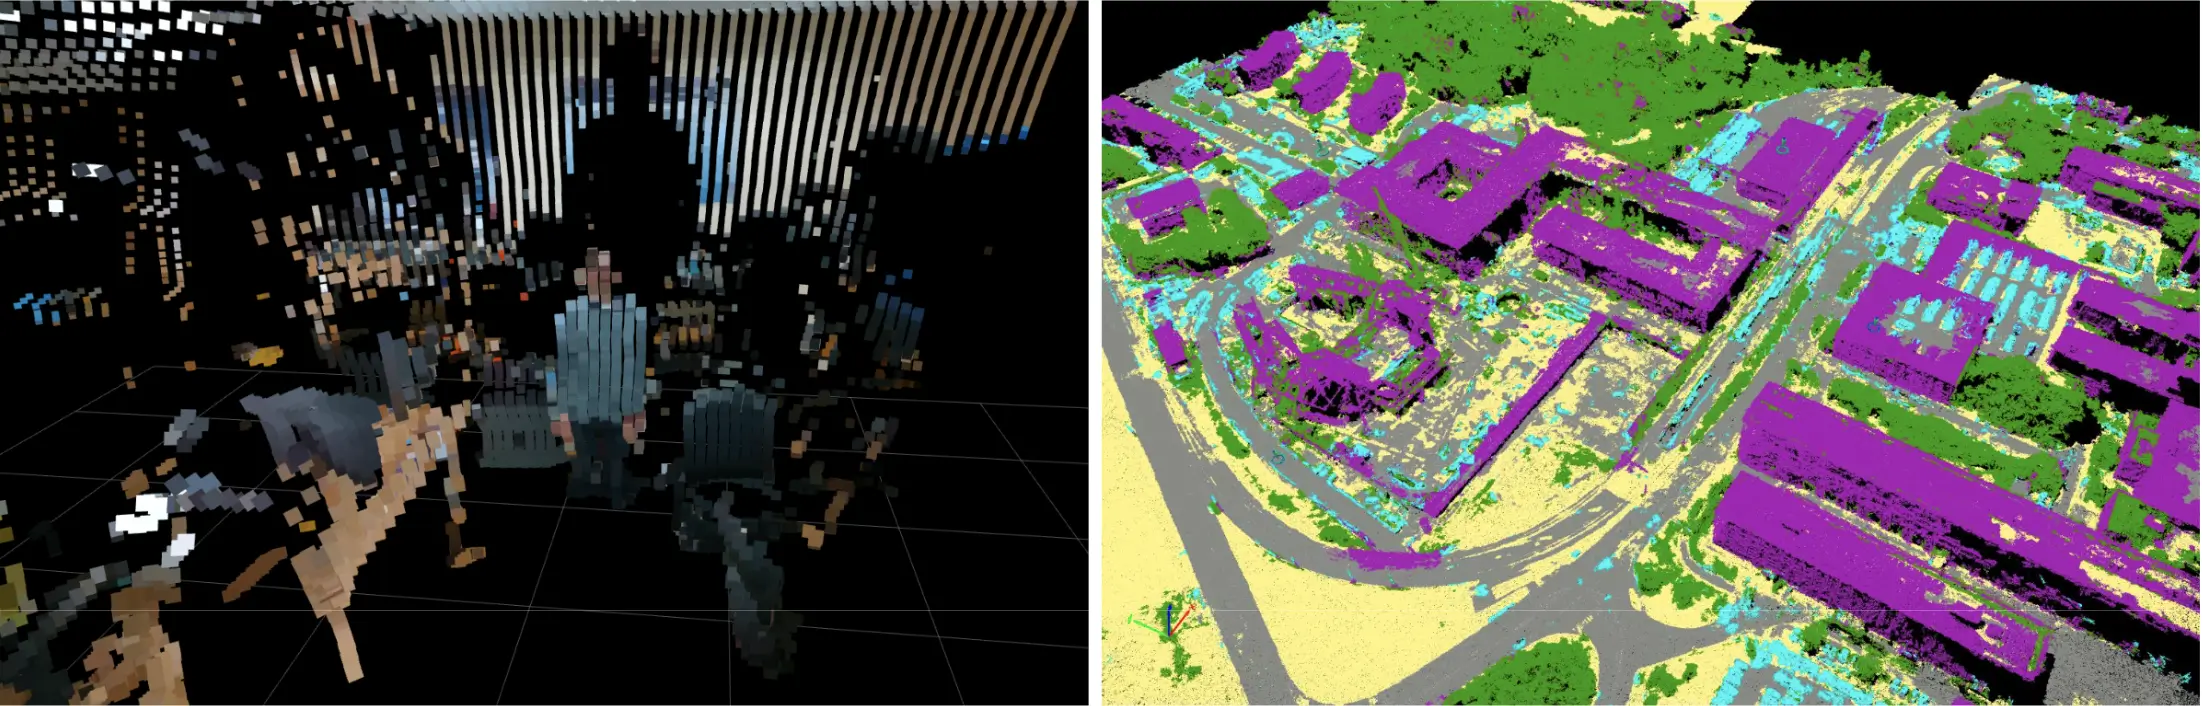

L: Mapping camera feed image colors to point colors using color_cloud, R: Color point clouds by object classification for construction surveying
When visualizing point cloud data gathered by your robot’s lidar, radar, and depth sensors, you may want to customize point colors to help you analyze the scan. You could map points to camera images to mimic the environment’s colors – with green points for trees, red for stop signs, and gray for curbs. You could also color the points by classification – like green for targets and red for obstacles.
Whatever your coloring logic, using customized point clouds can make a scan easier to interpret at a glance and dramatically streamline your analysis workflows. In this tutorial, we’ll cover how to use ROS and Foxglove schemas to create and display colorized point cloud messages in Foxglove.
Using ROS schemas
Build the message
To customize point colors for ROS 1 sensor_msgs/PointCloud2 and ROS 2 sensors_msgs/msg/PointCloud2 topics, each point must contain an rgb or rgba field with the appropriately packed bytes for color.
To do this, you’d specify your fields to describe your point’s position (using x, y, and z), and color.
You must represent the color field with a four-byte datatype – we recommend a value of 6 for UINT32 values. Each byte represents a color channel in the 0-255 range. Bytes must be packed in [0xBB, 0xGG, 0xRR, 0xAA] order (i.e. (0xAA < 24) | (0xRR < 16) | (0xGG < 8) | 0xBB, in little-endian order), which is compatible with how RViz expects this same information.
Let’s figure out how to write ROS 1 point cloud messages in Python using the mcap_ros1 package (mcap_ros2 also available for ROS 2).
To start, import the MCAP writer and some other important packages:
import sys
import math
import struct
from mcap_ros1.writer import Writer
from std_msgs.msg import Header
from geometry_msgs.msg import Point
from sensor_msgs.msg import PointCloud2, PointField
from rospy import TimeDefine the fields that each point in the point cloud will include. Note the single rgba field for the color:
fields = [
   PointField("x", 0, PointField.FLOAT32, 1),
   PointField("y", 4, PointField.FLOAT32, 1),
   PointField("z", 8, PointField.FLOAT32, 1),
   PointField("rgba", 12, PointField.UINT32, 1),
]
Let’s assume we have a color method that assigns an arbitrary color to a given point. Pack each point into your buffer with its corresponding color information – note that we include these bytes in BGRA order:
point_struct = struct.Struct("<fffBBBB")
def make_point_cloud(stamp: Time):
   # Create a 20x20 grid of points that move around over time
   t = stamp.to_sec()
   points = [
       Point(x=x + math.cos(t + y / 5), y=y, z=0) for x in range(20) for y in range(20)
   ]
   buffer = bytearray(point_struct.size * len(points))
   for i, point in enumerate(points):
       r, g, b, a = color(point, t)
       point_struct.pack_into(
           buffer, i * point_struct.size, point.x, point.y, point.z, b, g, r, a
       )
Create a point cloud message with our previously defined fields and packed data, and write it to your MCAP file:
python return PointCloud2( header=Header(frame_id="pc2", stamp=stamp), height=1, width=len(points), is_dense=False, is_bigendian=False, fields=fields, point_step=point_struct.size, row_step=len(buffer), data=buffer, ) with open(sys.argv[1], "wb") as f: ros_writer = Writer(f) for i in range(0, 60 * 10): stamp = Time(i / 60) ros_writer.write_message("/pc2", make_point_cloud(stamp), stamp.to_nsec()) ros_writer.finish()
You can reference the full code snippet in the foxglove/tutorials GitHub repo.
Visualize in Foxglove
Foxglove’s 3D panel provides two options for displaying ROS PointCloud2 topics – “BGR” and “BGRA” (named to accurately reflect the actual byte order). When using the “BGR” mode, the point cloud message’s alpha value is still required, but will be ignored.
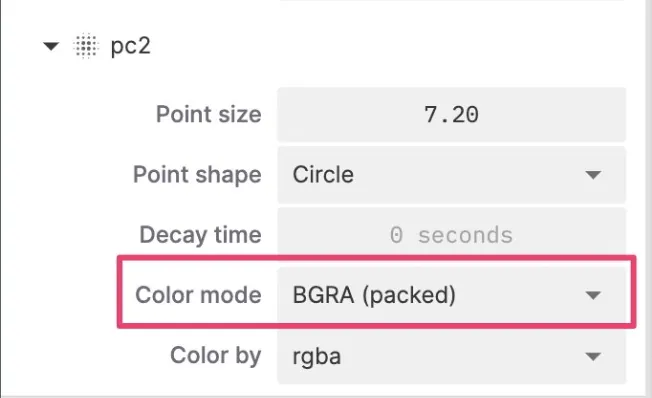
Open a 3D panel and load a data source with point cloud data. In the panel settings sidebar, find your point cloud topic and ensure you have “BGR (packed)” or “BGRA (packed)” selected:
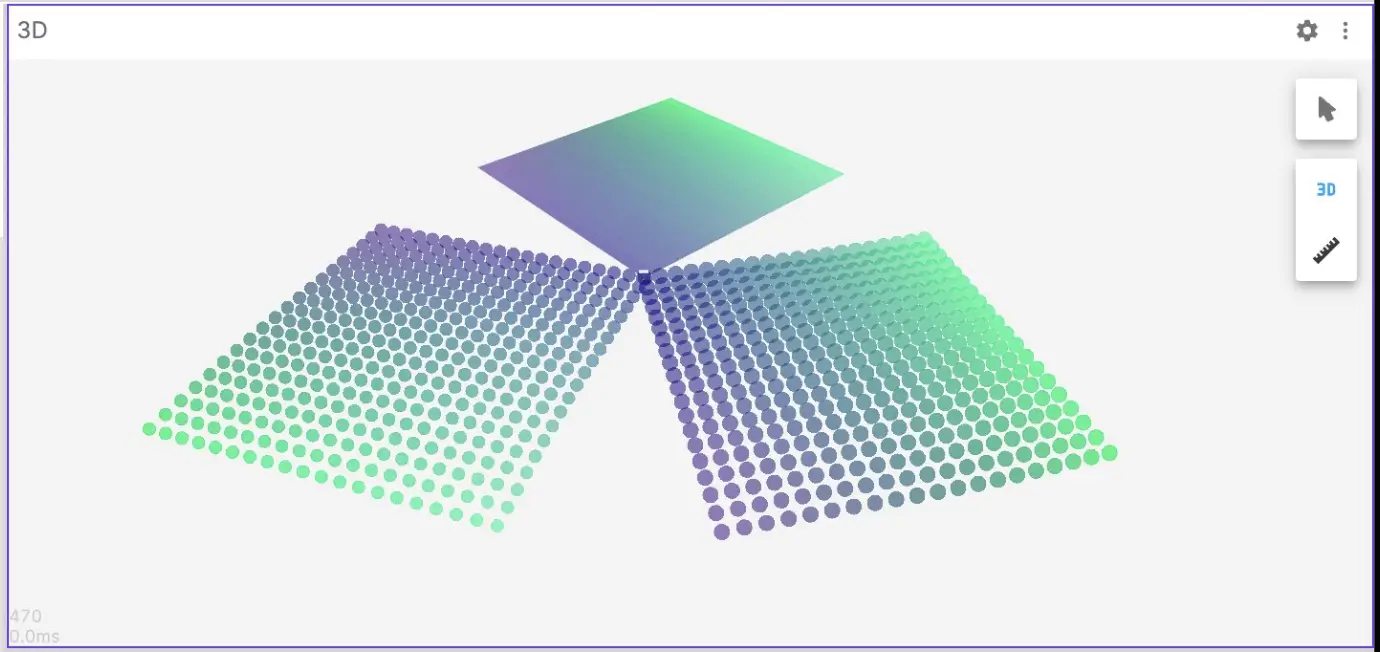
This ensures that your custom colors will be displayed in the 3D panel:
Using Foxglove schemas
Build the message
For foxglove.PointCloud topics, Foxglove’s 3D panel supports a “RGBA (separate fields)” color mode. In this mode, the 3D panel reads RGBA values from four separate “red”, “green”, “blue”, and “alpha” fields.
Some example values, given each numeric type:
Let’s say we’re using the MCAP writer to write foxglove.PointCloud messages in JSON format. That means we will need to use this Foxglove schema for point clouds in JSON.
Set some important constants:
width = 20
height = 20
point_stride = 3 * 4 + 4 * 1  # 3 FLOAT32 fields + 4 UINT8 fields
data = bytearray(width * height * point_stride)
Define the fields that each point in the point cloud will include – note the 4 separate color fields (red, green, blue, and alpha):
fields = [
    {"name": "x", "offset": 0, "type": 7},
    {"name": "y", "offset": 4, "type": 7},
    {"name": "z", "offset": 8, "type": 7},
    {"name": "red", "offset": 12, "type": 1},
    {"name": "green", "offset": 13, "type": 1},
    {"name": "blue", "offset": 14, "type": 1},
    {"name": "alpha", "offset": 15, "type": 1},
]
Pack each point in data with its corresponding color information – note that we include the colors in RGBA order to match the order of our fields:
offset = 0
for x in range(width):
   for y in range(height):
       r, g, b, a = color(x, y)
       struct.pack_into(
           "<fffBBBB",
           data,
           offset,
           x + 0.2 * y / height * math.sin(2 * math.pi * (tt + y / height)),
           y,
           0,
           round(r * 255),
           round(g * 255),
           round(b * 255),
           round(a * 255),
       )
       offset += point_stride
Create a point cloud message with our previously defined fields and packed data (encoded with base64), and write it to your MCAP file:
pointcloud = {
   "timestamp": timestamp,
   "frame_id": "cloud",
   "pose": {"position": {"x": 0, "y": 0, "z": 0}, "orientation": {"x": 0, "y": 0, "z": 0, "w": 1}},
   "point_stride": point_stride,
   "fields": fields,
   "data": base64.b64encode(data).decode(),
}
writer.add_message(ch1, t, json.dumps(pointcloud).encode(), t)
You can reference the full code snippet here.
Visualize in Foxglove
Foxglove’s 3D panel provides the “RGBA (separate fields)” Color mode for displaying foxglove.PointCloud topics with your custom colors.
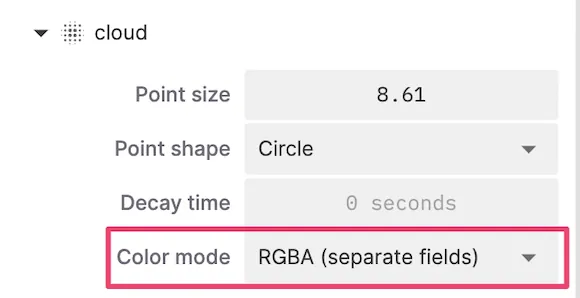
Open a 3D panel in Foxglove, and load your data source with point cloud data. In the Panel settings sidebar tab, find your point cloud topic and select “RGBA (separate fields)” as the “Color mode”:
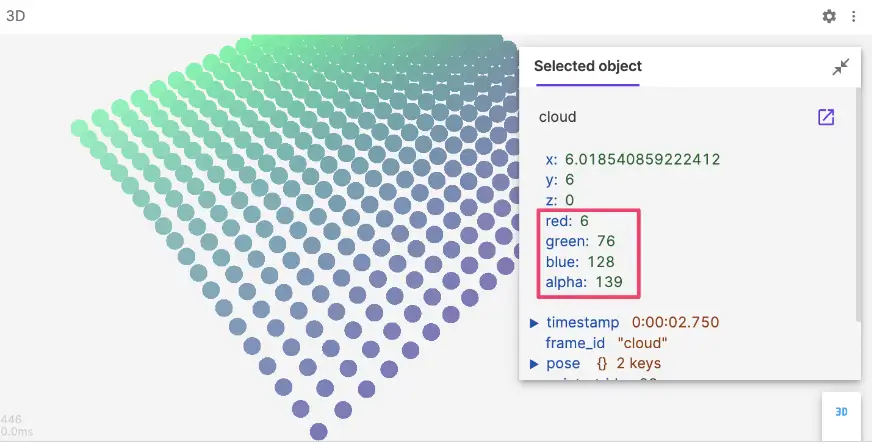
This ensures that your custom colors will be displayed in the 3D panel:
Learn more
In addition to customizing point clouds, Foxglove has also added custom color support for foxglove.Grid messages.
Coloring your point clouds during debugging can help you present more information about your robot’s world in a visually intuitive and digestible way. Not only does this inform your debugging strategies, it also streamlines your analysis workflows by allowing you to understand more at a glance.
For a list of all supported visualization message types, check out Foxglove’s 3D panel docs. Please feel free to reach out to us in our Discord community if you have any other visualization requests!