Working with scenes and Pointclouds.


This tutorial shows how to generate scenes and pointclouds from different file formats using the REHEARSE-3D dataset, a Multi-modal Emulated Rain Dataset for 3D Point Cloud De-raining. It is multi-modal because it contains different data types such as lidar, radra and images, both RGB and thermal. Emulated because the rain is artificially created by using sprinkles. The data can be downloaded following this link: REHEARSE3D.
The data is presented in different file formats such as jpeg for images, binary files (.bin) for pointclouds and csv files for radra detection and weather data. In this tutorial we will learn how to integrate all these different file formats into an MCAP file and visualize the data in Foxglove.
The code explained.
Following good coding practices, the code will be split into different functions that will serve a specific purpose. This helps to write clean and readable code and makes the testing easier. The functions will be organized in files that can be executed independently. This is useful when generating partial visualizations, for example if only a lidar data is required. Later, the main executable code will import the functions as modules and will generate the complete MCAP file for visualization.
Create a folder structure like this:
- rehearse_derain
- code: save here the code files
- data: save here the downloaded dataset
- output: the generated mcap will be saved here
Code files.
The first file called utils.py has several functions. The functions in this file will be helpful in the future when processing the data. The first function called open_csv reads a csv file and returns the list of the rows and the available fields. The second function called get_metadata_from_folder looks for a file named metadata.csv inside a folder and will return the data as rows. The metadata in this case contains the timestamp and the file path to each message. The last function called generate_pallete creates a color palette from red to green using a value between 0 and 1.
# utils.py
import os
import csv


def open_csv(file_path: str) -> list[dict]:
    """
        Open a CSV file and return its contents as a list of dictionaries
        Input:
            file_path (str): Path to the CSV file
        Output:
            list[dict]: List of dictionaries representing the CSV rows

    """
    with open(file_path, "r", encoding="utf-8") as file:
        csv_reader = csv.DictReader(file)
        fields = csv_reader.fieldnames
        data = list(csv_reader)
    return data, fields


def get_metadata_from_folder(folder) -> list[dict]:
    """
    Reads metadata from a folder containing CSV files.
    Args:
        folder (str): Path to the folder containing CSV files.
    Returns:
        list[dict]: List of dictionaries containing metadata from each CSV file.
    """
    metadata = []
    metadata_path = os.path.join(folder, "metadata.csv")
    if os.path.exists(metadata_path):
        print(f"Metadata file found in {folder}")
        metadata, _ = open_csv(metadata_path)

    return metadata


def generate_palette(value, num_colors=50):
    # Ensure the value is between 0 and 1
    value = max(0, min(1, value))

    # Generate a palette from red to green
    palette = []
    for i in range(num_colors):
        # Calculate the RGB values
        red = int(255 * (1 - i / (num_colors - 1)))
        green = int(255 * (i / (num_colors - 1)))
        blue = 0
        palette.append((red, green, blue))

    # Select a color based on the input value
    selected_index = int(value * (num_colors - 1))
    selected_color = palette[selected_index]
    r, g, b = selected_color[0], selected_color[1], selected_color[2]

    return r, g, b
Next file contains the function to process images in a folder. The function is called generate_image_viz. This function will first get the metadata from a folder and using the information in this data, it generates a CompressedImageChannel using the images in the folder.
# process_images.py

import os

from foxglove.channels import (
    CompressedImageChannel,
)
from foxglove.schemas import (
    Timestamp,
    CompressedImage,
)

from utils import get_metadata_from_folder


def generate_image_viz(folder, topic_name) -> None:
    """
    Generates a CompressedImage topic from a folder of images.
    Args:
        folder (str): Path to the folder containing images.
        topic_name (str): Name of the topic to create.
    """
    print(f"Image viz from: {folder} with topic {topic_name}")

    # Define the channel for compressed images
    channel = CompressedImageChannel(topic=topic_name)

    metadata = get_metadata_from_folder(folder)

    for i, data in enumerate(metadata):
        filename = os.path.basename(data["Filename"])
        image_path = os.path.join(folder, filename)
        stamp = int(data["Stamp"])
        sec = int(stamp / 1e9)
        nsec = int(stamp % 1e9)
        if os.path.exists(image_path):
            timestamp = Timestamp(sec=sec, nsec=nsec)
            with open(image_path, "rb") as file:
                img = file.read()
                data = img

            # Create a CompressedImage message
            compressed_image = CompressedImage(
                timestamp=timestamp,
                frame_id=topic_name,
                format="jpeg",
                data=data
            )
            channel.log(
                compressed_image,
                log_time=stamp,
            )
            print(f"Processed image {i + 1}/{len(metadata)}: {filename}")
The following file is used to process lidar as a pointcloud. The function called generate_lidar_viz gets the metadata from a folder and using the .bin files that contain pointcloud data in the form of x,y,z,intensity values, generates a PointCloud message published thought a channel.
# process_lidar.py
import os

import numpy as np

import foxglove
from foxglove.channels import (
    PointCloudChannel,
)
from foxglove.schemas import (
    Timestamp,
    PointCloud,
    PackedElementField,
    PackedElementFieldNumericType
)

from utils import get_metadata_from_folder

f32 = PackedElementFieldNumericType.Float32
u32 = PackedElementFieldNumericType.Uint32


def generate_lidar_viz(folder, topic_name="/lidar", fields=None) -> None:
    """
    Generates a PointCloud topic from a folder of bin files.
    Args:
        folder (str): Path to the folder containing bin files.
        topic_name (str): Name of the topic to create.
    """
    print(f"LiDAR viz from: {folder} with topic {topic_name}")

    # Define the channel for compressed images
    channel = PointCloudChannel(topic=topic_name)

    metadata = get_metadata_from_folder(folder)

    if fields is None:
        fields = [
            PackedElementField(name="x", offset=0, type=f32),
            PackedElementField(name="y", offset=4, type=f32),
            PackedElementField(name="z", offset=8, type=f32),
            PackedElementField(name="intensity", offset=12, type=u32),
        ]

    else:
        fields = [PackedElementField(name=field, offset=4*i, type=f32)
                  for i, field in enumerate(fields)]

    for i, data in enumerate(metadata):
        filename = os.path.basename(data["Filename"])
        file_path = os.path.join(folder, filename)
        stamp = int(data["Stamp"])
        sec = int(stamp / 1e9)
        nsec = int(stamp % 1e9)
        if os.path.exists(file_path):
            timestamp = Timestamp(sec=sec, nsec=nsec)
            bin_pcd = np.fromfile(file_path, dtype=np.float32)

            pc = PointCloud(
                timestamp=timestamp,
                frame_id="base",
                # 4 floats per point (x, y, z, intensity)
                point_stride=4*len(fields),
                fields=fields,
                data=bin_pcd.tobytes(),  # Convert to bytes for PointCloud
            )

            channel.log(
                pc,
                log_time=stamp,
            )
            print(f"Processed point cloud {i + 1}/{len(metadata)}: {filename}")


if __name__ == "__main__":
    print("Generating LiDAR visualization...")
    writer = foxglove.open_mcap("lidar.mcap", allow_overwrite=True)
    generate_lidar_viz("REHEARSE RAIN/data/000/innoviz", "/lidar")
The following file is used to process radar data stored as a csv file. The function called generate_radar_viz gets the metadata from a folder and parses the csv file for each message of the radar being published. There is an additional function called generate_spheres that is used to generate the scene entities of type sphere for each radar detection.
# process_radar_csv.py

import os

import foxglove
from foxglove.schemas import (
    Pose,
    Vector3,
    Quaternion,
    Color,
    SpherePrimitive,
    SceneEntity,
    SceneUpdate,
    Timestamp
)

from foxglove.channels import SceneUpdateChannel

from utils import open_csv, get_metadata_from_folder, generate_palette


def generate_spheres(position, intensity, cross_section, speed, confidence):
    """
    Generates a SceneEntity for the radar visualization.
    Args:
        position (tuple): Position of the entity in the scene.
        size (tuple): Size of the entity in the scene. Radius of cylinder.
        speed (float): Speed of the entity. Length of cylinder.
        confidence (float): Confidence level of the detection. Color of cylinder.
    Returns:
        SceneEntity: A SceneEntity object representing the radar data.
    """

    r, g, b = generate_palette(confidence)
    sphere = SpherePrimitive(
        pose=Pose(
            position=Vector3(
                x=position[0], y=position[1], z=position[2]
            ),
            orientation=Quaternion(x=0, y=0, z=0, w=1),
        ),
        size=Vector3(
            x=speed, y=intensity, z=cross_section),
        color=Color(r=r, g=g, b=b, a=1),
    )

    return sphere


def generate_radar_viz(folder, topic_name="/radar") -> None:
    """
    Generates a radar visualization topic from the radar images folder.
    This function reads the radar images and generates a CompressedImage topic.
    """

    print(f"RADAR viz from: {folder} with topic {topic_name}")

    radar_scene_update = SceneUpdateChannel(topic_name)

    metadata = get_metadata_from_folder(folder)

    for i, data in enumerate(metadata):
        filename = os.path.basename(data["Filename"])
        file_path = os.path.join(folder, filename)
        stamp = int(data["Stamp"])
        sec = int(stamp / 1e9)
        nsec = int(stamp % 1e9)
        if os.path.exists(file_path):
            get_csv_data, _ = open_csv(file_path)
            intensity_max = -1e3
            cross_section_max = -1e3
            velocity_max = -1e3
            confidence_max = -1e3
            confidence_min = 1e3
            spheres = []

            for row in get_csv_data:
                intensity = float(row["INTENSITY"])
                cross_section = abs(float(row["CROSS_SECTION"]))
                velocity = float(row["VELOCITY"])
                confidence = float(row["CONF"])
                intensity_max = max(intensity_max, intensity)
                cross_section_max = max(cross_section_max, cross_section)
                velocity_max = max(velocity_max, velocity)
                confidence_max = max(confidence_max, confidence)
                confidence_min = min(confidence_max, confidence)

            # print(confidence_max, confidence_min)
            for row in get_csv_data:
                position = (
                    float(row["X"]),
                    float(row["Y"]),
                    float(row["Z"]),
                )
                intensity = float(row["INTENSITY"]) / intensity_max
                cross_section = abs(
                    float(row["CROSS_SECTION"])) / cross_section_max
                speed = float(row["VELOCITY"]) / velocity_max
                confidence = (
                    float(row["CONF"])-confidence_min) / (confidence_max-confidence_min)

                sphere = generate_spheres(
                    position, intensity, cross_section, speed, confidence)

                spheres.append(sphere)

            timestamp = Timestamp(sec=sec, nsec=nsec)
            scene_entity = SceneEntity(
                timestamp=timestamp,
                id="radar",
                frame_id="base",
                spheres=spheres,
            )

            scene_update = SceneUpdate(
                entities=[scene_entity],
            )

            radar_scene_update.log(scene_update, log_time=stamp)

            print(f"Processed radar {i + 1}/{len(metadata)}: {filename}")


if __name__ == "__main__":
    writer = foxglove.open_mcap("radar.mcap", allow_overwrite=True)
    generate_radar_viz("REHEARSE RAIN/data/000/ext_radar")
The last file also processes csv data but in this case the data contains weather information. The data is published in a channel with json encoding built using the headers of the csv file as elements of the message.
# process_weather.py
import os

import foxglove
from foxglove import Channel

from utils import open_csv


def generate_weather_viz(folder, topic_name="/weather") -> None:
    print(f"Weather data from: {folder} with topic {topic_name}")

    channel = Channel(topic=topic_name)

    for file in os.listdir(folder):
        filepath = os.path.join(folder, file)
        data, fields = open_csv(filepath)
        for i, data in enumerate(data):
            stamp = int(data["Stamp"])
            weather_data = {}
            for field in fields:
                if field in ["Sequence"]:
                    continue
                weather_data[field] = data[field]

            channel.log(
                weather_data,
                log_time=stamp,
            )

            print(f"Processed data {i + 1}/{len(data)}: {file}")


if __name__ == "__main__":
    writer = foxglove.open_mcap("weather.mcap", allow_overwrite=True)
    generate_weather_viz(
        "/Volumes/SandiskSSD/JLMV/Foxglove/REHEARSE RAIN/data/000/weather")
Finally, the last file contains the main executable, called generate_mcap. This function gets the file path for every data type (images, lidar, radar,…) and calls the previously defined functions to generate the channels for each message.
# generate_mcap.py
import os

import foxglove

from process_radar_csv import generate_radar_viz
from process_images import generate_image_viz
from process_lidar import generate_lidar_viz
from process_weather import generate_weather_viz

ROOT_FOLDER = os.path.abspath(os.path.join(
    os.path.dirname(__file__), '..'))

SEQUENCES = ["000"]

OUTPUT_FOLDER = os.path.join(ROOT_FOLDER, "output")
os.makedirs(OUTPUT_FOLDER, exist_ok=True)


def generate_mcap():
    mcap_filename = "rehearse_derain.mcap"
    mcap_path = os.path.join(OUTPUT_FOLDER, mcap_filename)
    writer = foxglove.open_mcap(mcap_path, allow_overwrite=True)

    for sequence in SEQUENCES:
        print(f"Processing sequence: {sequence}")
        FLIR_IMGS_FOLDER = os.path.join(ROOT_FOLDER, "data", sequence, "flir")
        ARENA_IMGS_FOLDER = os.path.join(
            ROOT_FOLDER, "data", sequence, "arena")
        RADAR_FOLDER = os.path.join(ROOT_FOLDER, "data", sequence, "ext_radar")
        INNOVIZ_FOLDER = os.path.join(ROOT_FOLDER, "data", sequence, "innoviz")
        OUSTER_FOLDER = os.path.join(ROOT_FOLDER, "data", sequence, "ouster")
        WEATHER_FOLDER = os.path.join(ROOT_FOLDER, "data", sequence, "weather")

        generate_image_viz(FLIR_IMGS_FOLDER, f"{sequence}/flir")
        generate_image_viz(ARENA_IMGS_FOLDER, f"{sequence}/arena")
        generate_radar_viz(RADAR_FOLDER, f"{sequence}/radar")
        generate_lidar_viz(INNOVIZ_FOLDER, f"{sequence}/innoviz")
        generate_lidar_viz(OUSTER_FOLDER, f"{sequence}/ouster")
        generate_weather_viz(WEATHER_FOLDER, f"{sequence}/weather")

    writer.close()

    print(f"MCAP file generated at: {mcap_path}")


if __name__ == "__main__":
    generate_mcap()
Now that the code is ready, execute the main file with the command:
python3 generate_mcap.pyAn MCAP file will appear in the output folder. Open the file with Foxglove and import the layout for the visualization.
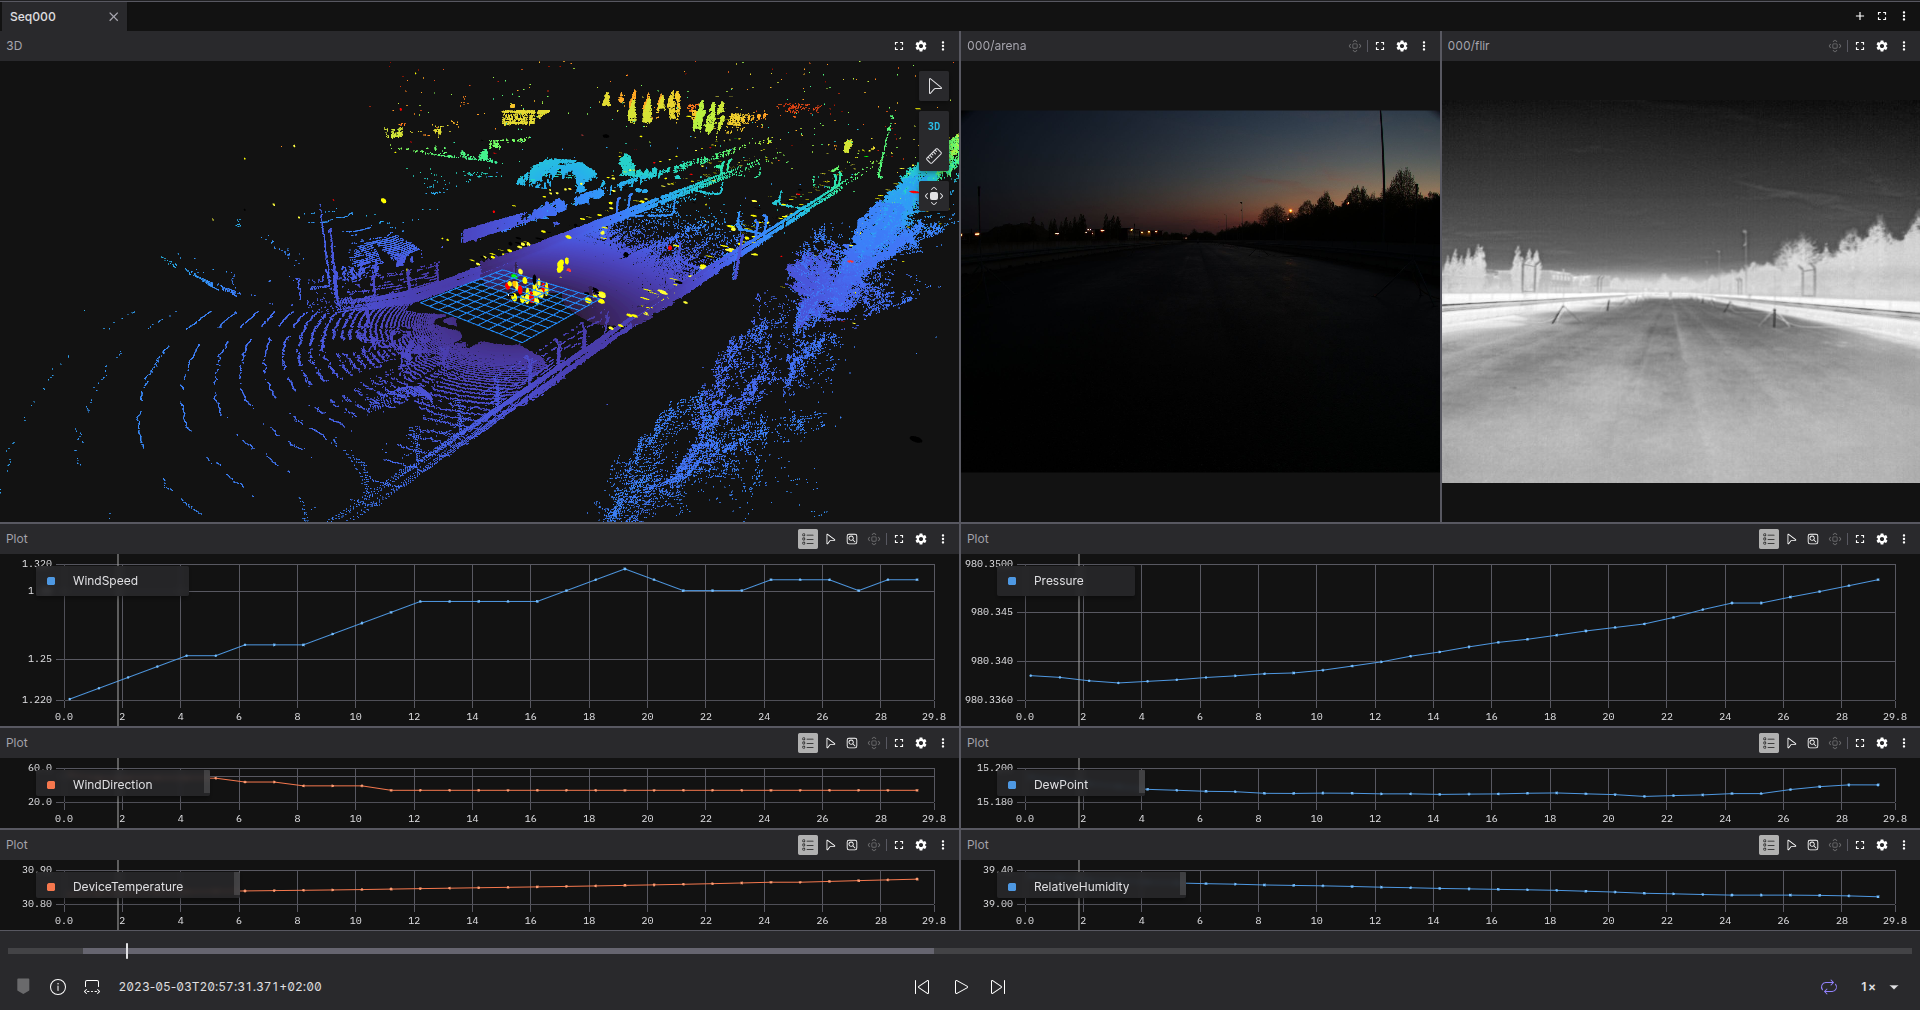
Visualizing with Foxglove.
Open the generated MCAP in Foxglove and create a layout for sequence 000 of the dataset. Our example contains a 3D panel, two image panels, and plots. The 3D panel shows the LIDAR and radar data, the image panels show RGB and thermal images, and the plots represent the weather data.
As this dataset has several sequences, we can create a new tab to visualize another sequence.
Rerun the python file adding another sequence in the code:
SEQUENCES = ["000", "051"]The code will generate a different topic for each sequence. This is helpful to compare side-by-side with the same configuration of the panel, just by duplicating and changing the topics.
Open a new tab and call it Comparison. Add a 3D panel and visualize the topics 000/innoviz , 000/ouster and 000/radar. Now duplicate this panel and change the topics for the ones of sequence 051. Now you can compare each sequence at the same time.
Leveraging visualization to improve AI.
Physical AI is bound to the real world by the data gathered to train the algorithms. These huge amounts of data require an easy and fast method to understand and compare the different situations of the environment. Using Foxglove can greatly simplify these tasks by providing a fast and adaptable visualization.
Get started with Foxglove and MCAP today! If you have any questions or need support, join our community—we’d love to hear from you and help you succeed.