Annotate Your Robot's Camera Images with Image Markers
Translate image detection outputs into human-readable visualizations
Whether you just got started with ROS or have a robotic duck roaming around your house, giving your robot more sensor inputs can be a great next step to take in your robotics journey, and adding a camera to your robot can be a simple and powerful way to do just that.
Teaching a robot to understand what it’s seeing through a camera might sound complicated, but it doesn’t have to be! As machine learning has become popular, it’s also become much more accessible to non-experts, and there are now plenty of off-the-shelf toolkits that make it simple to analyze data and detect patterns.
When analyzing your sensor data, it can be helpful to see your outputs visually. A common approach for camera images is to produce an image that has been annotated with relevant markers. However, there are several limitations to drawing directly on the image – markers can cover pixels in the original image, appear blurry on small images, and be costly to store.
You can tackle these issues by using image markers, a kind of vector graphics that Foxglove can draw on top of the image. Foxglove even enables you to easily turn them on or off in your layout’s Image panel.
In this post, we’ll set up a camera, run a face detection algorithm on the images, and use image markers in Foxglove to visualize the results. (If you’re not yet familiar with ROS nodes and topics, try reading The Building Blocks of ROS first — we’ll be using them in this tutorial.)
Setting up a camera node
This post assumes you have a working ROS 1 installation on your computer. I’m using ROS Noetic on Ubuntu 20.04, running in a virtual machine. If you need to set up ROS, follow these installation instructions.
The first thing we need is a camera connected to our robot. For the purposes of this demo, I’m using my laptop’s webcam, but you might be using another camera that plugs into a USB port. Let’s install a ROS package called usb_cam to interface with the camera and produce ROS sensor_msgs/Image messages:
$ sudo apt install ros-noetic-usb-camusb_cam comes with a launch file that will start up the camera driver and an image viewer, so we can see that our camera is working:
$ roslaunch usb_cam usb_cam-test.launch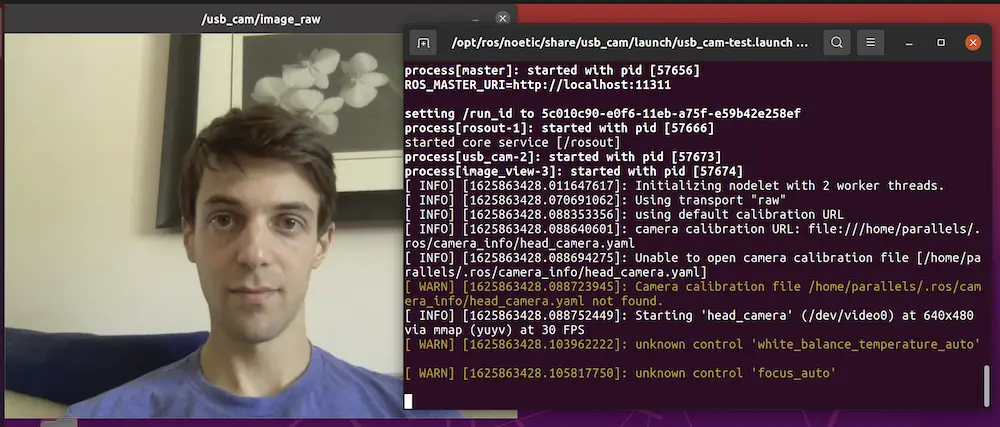
(If this doesn’t work for you, you might need to modify the usb_cam parameters to select the correct camera device, pixel format, and other settings. You can create your own copy of the usb_cam-test.launch file and adjust the parameters there.)
Looking deeper with Foxglove
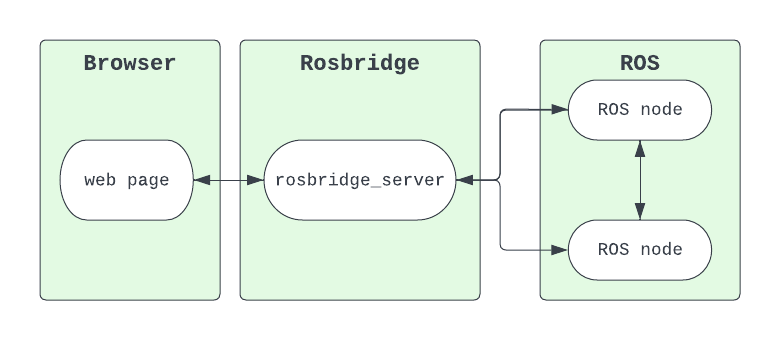
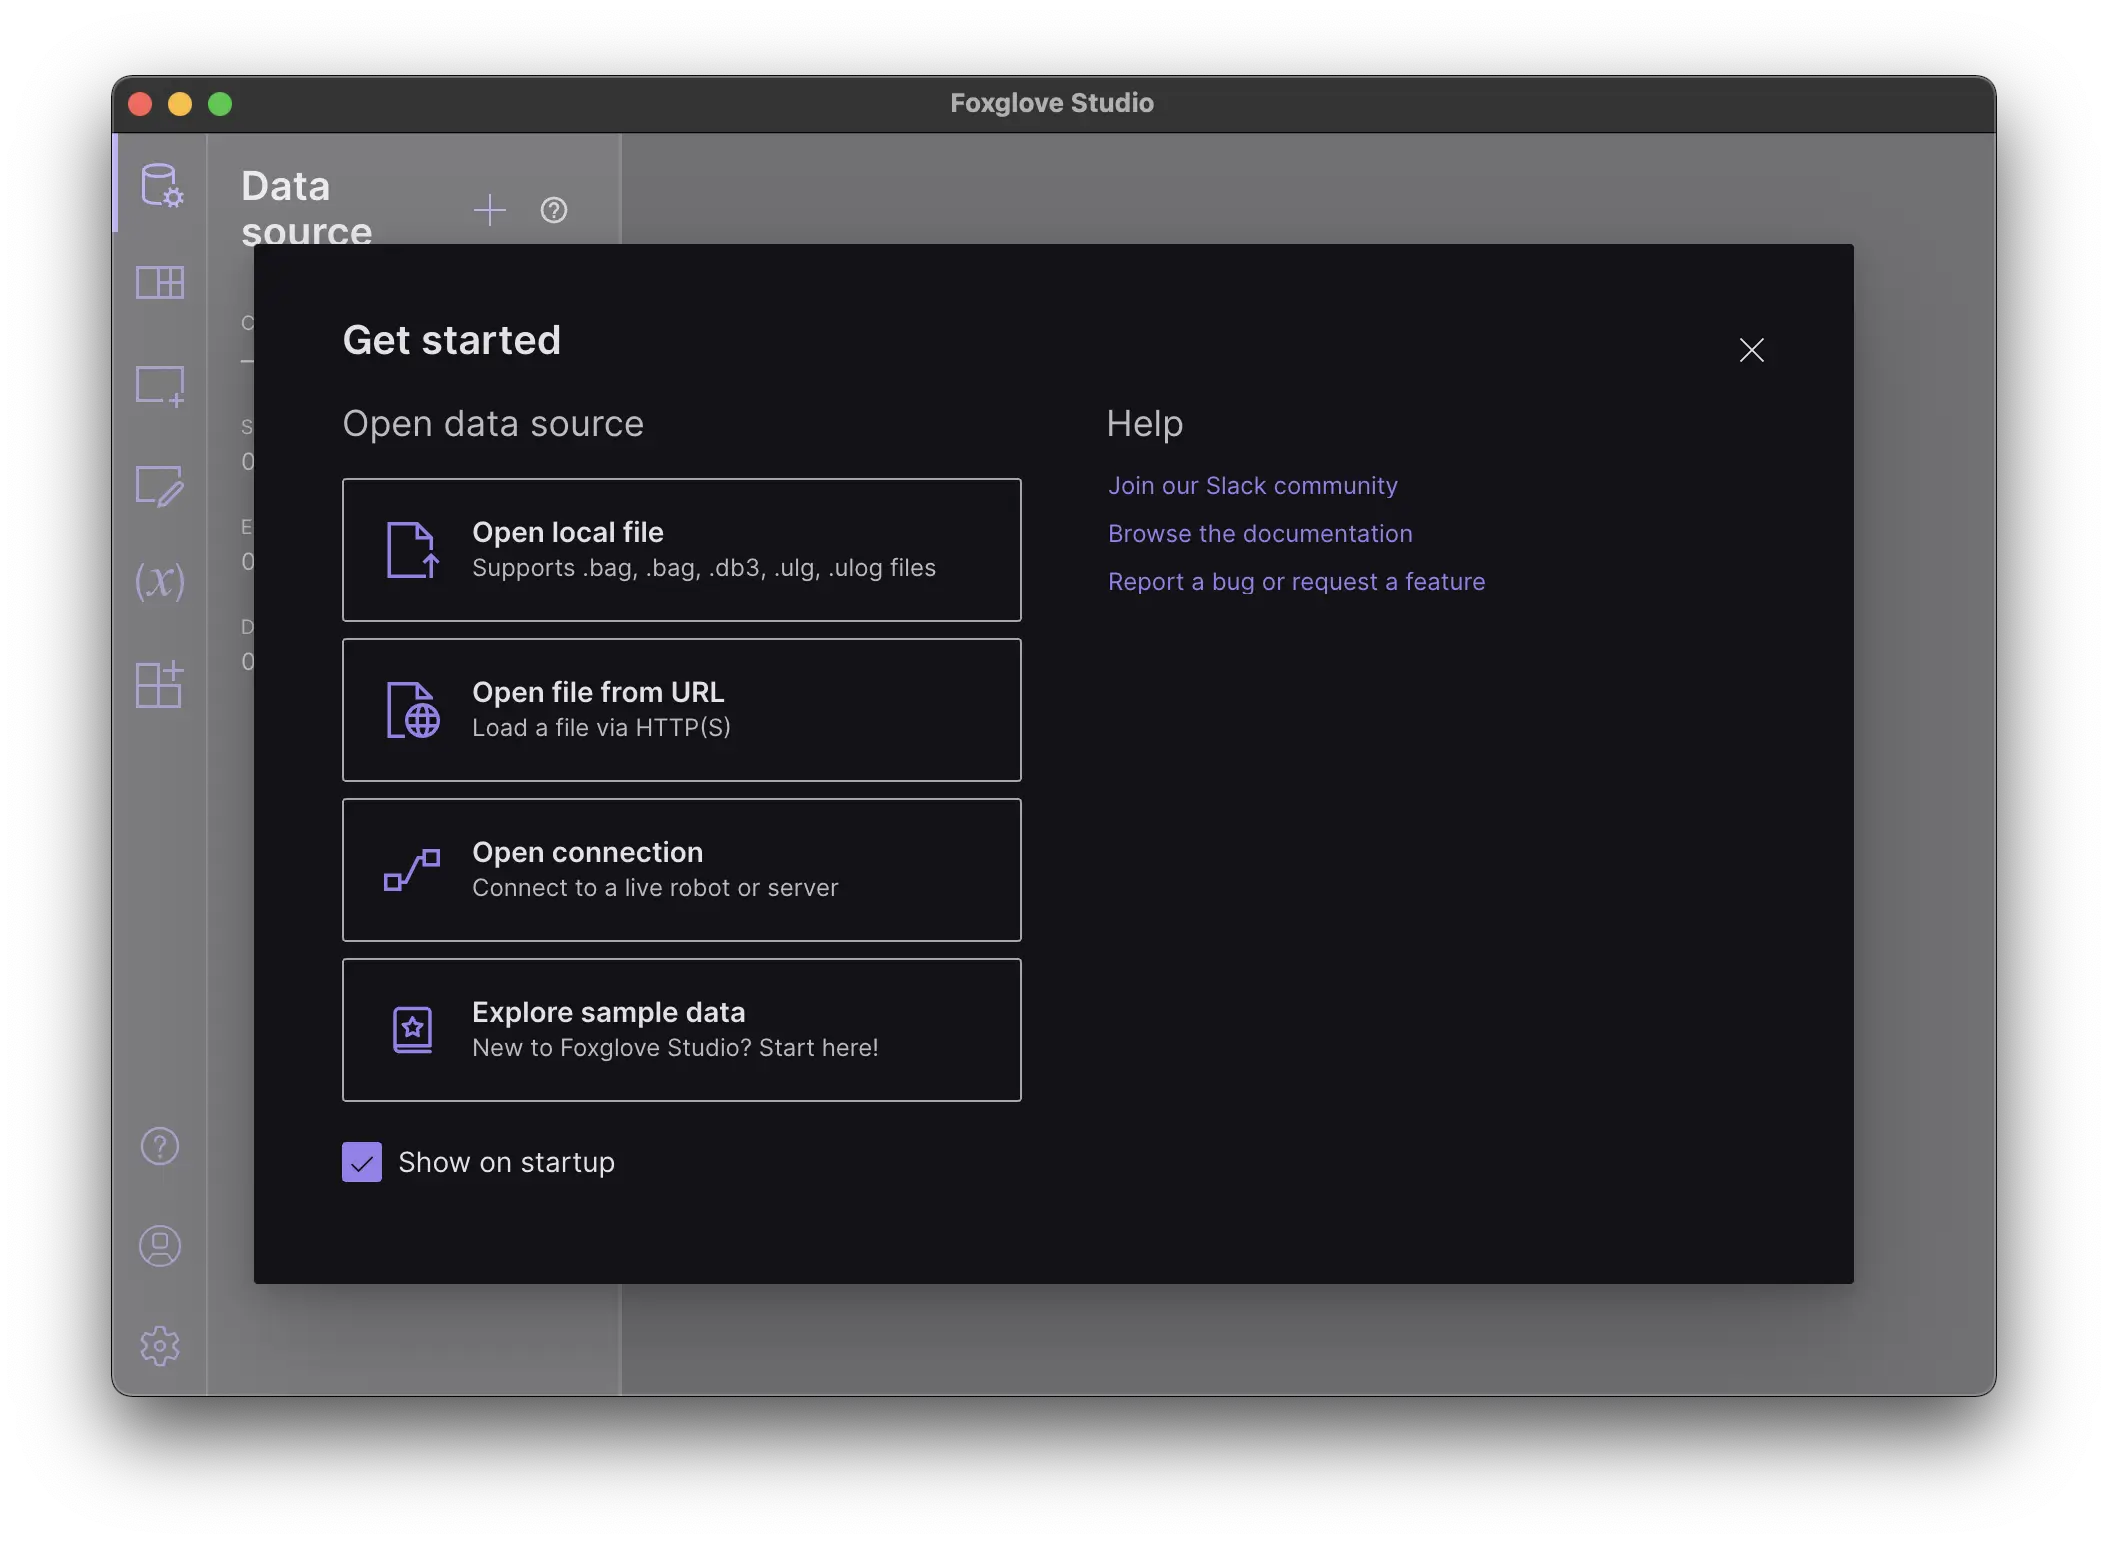
Behind the scenes, this has launched a ROS node that publishes sensor_msgs/Image messages on a new topic. To get a better idea of how this works, let’s hook up Foxglove and peek at the ROS graph. First we’ll connect to a ROS data source.
First, choose Open connection from the data source selection dialog:
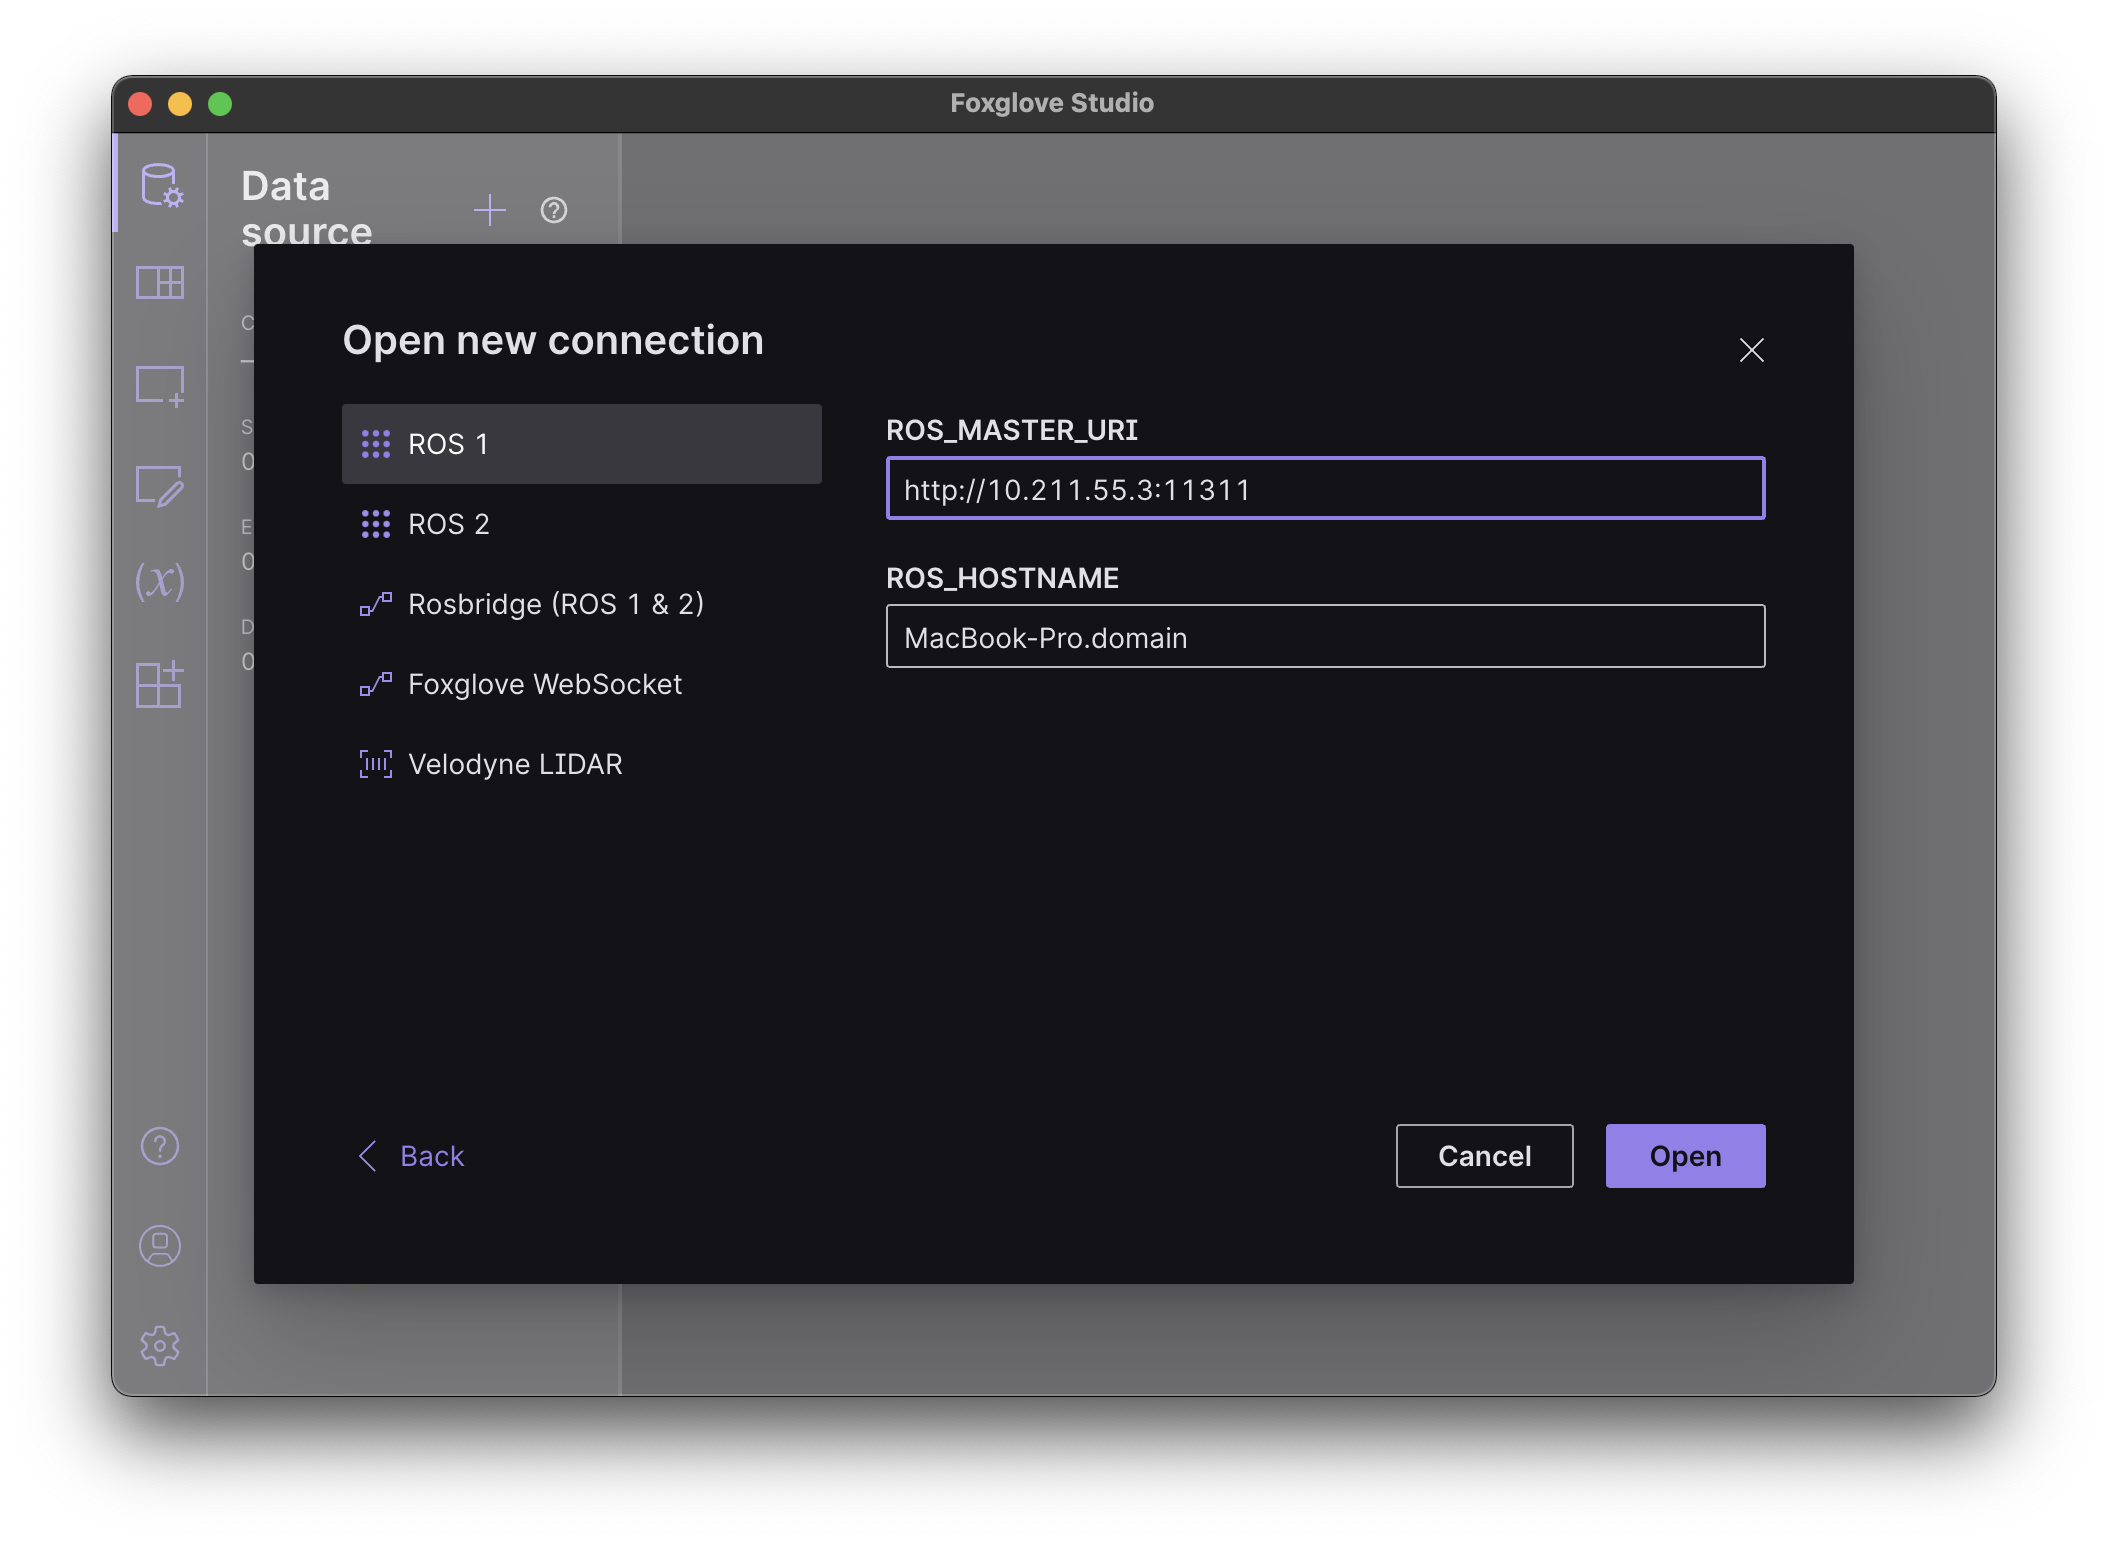
Select ROS 1 as the connection type. Since I’m using Ubuntu inside a virtual machine, I need to type an IP address where I can reach the Ubuntu guest before opening the connection.
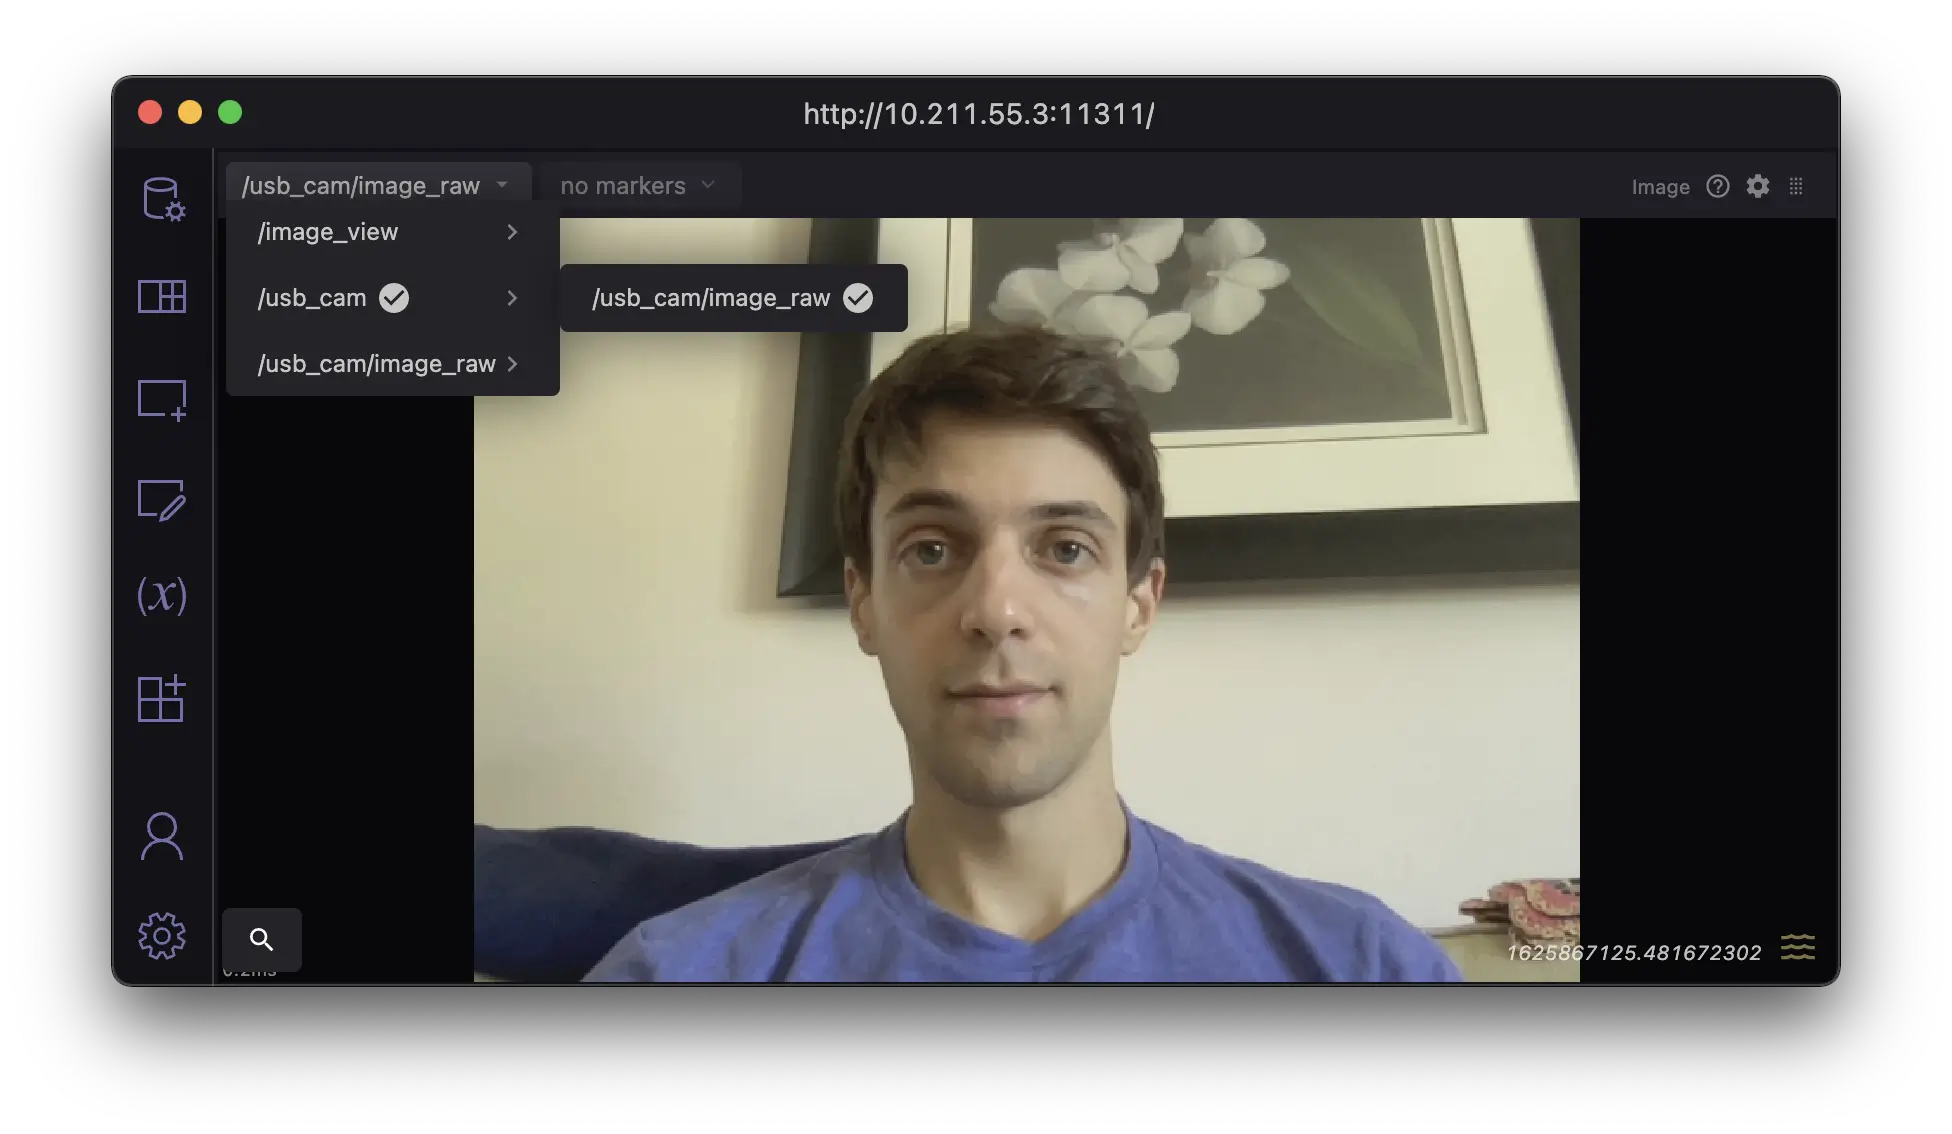
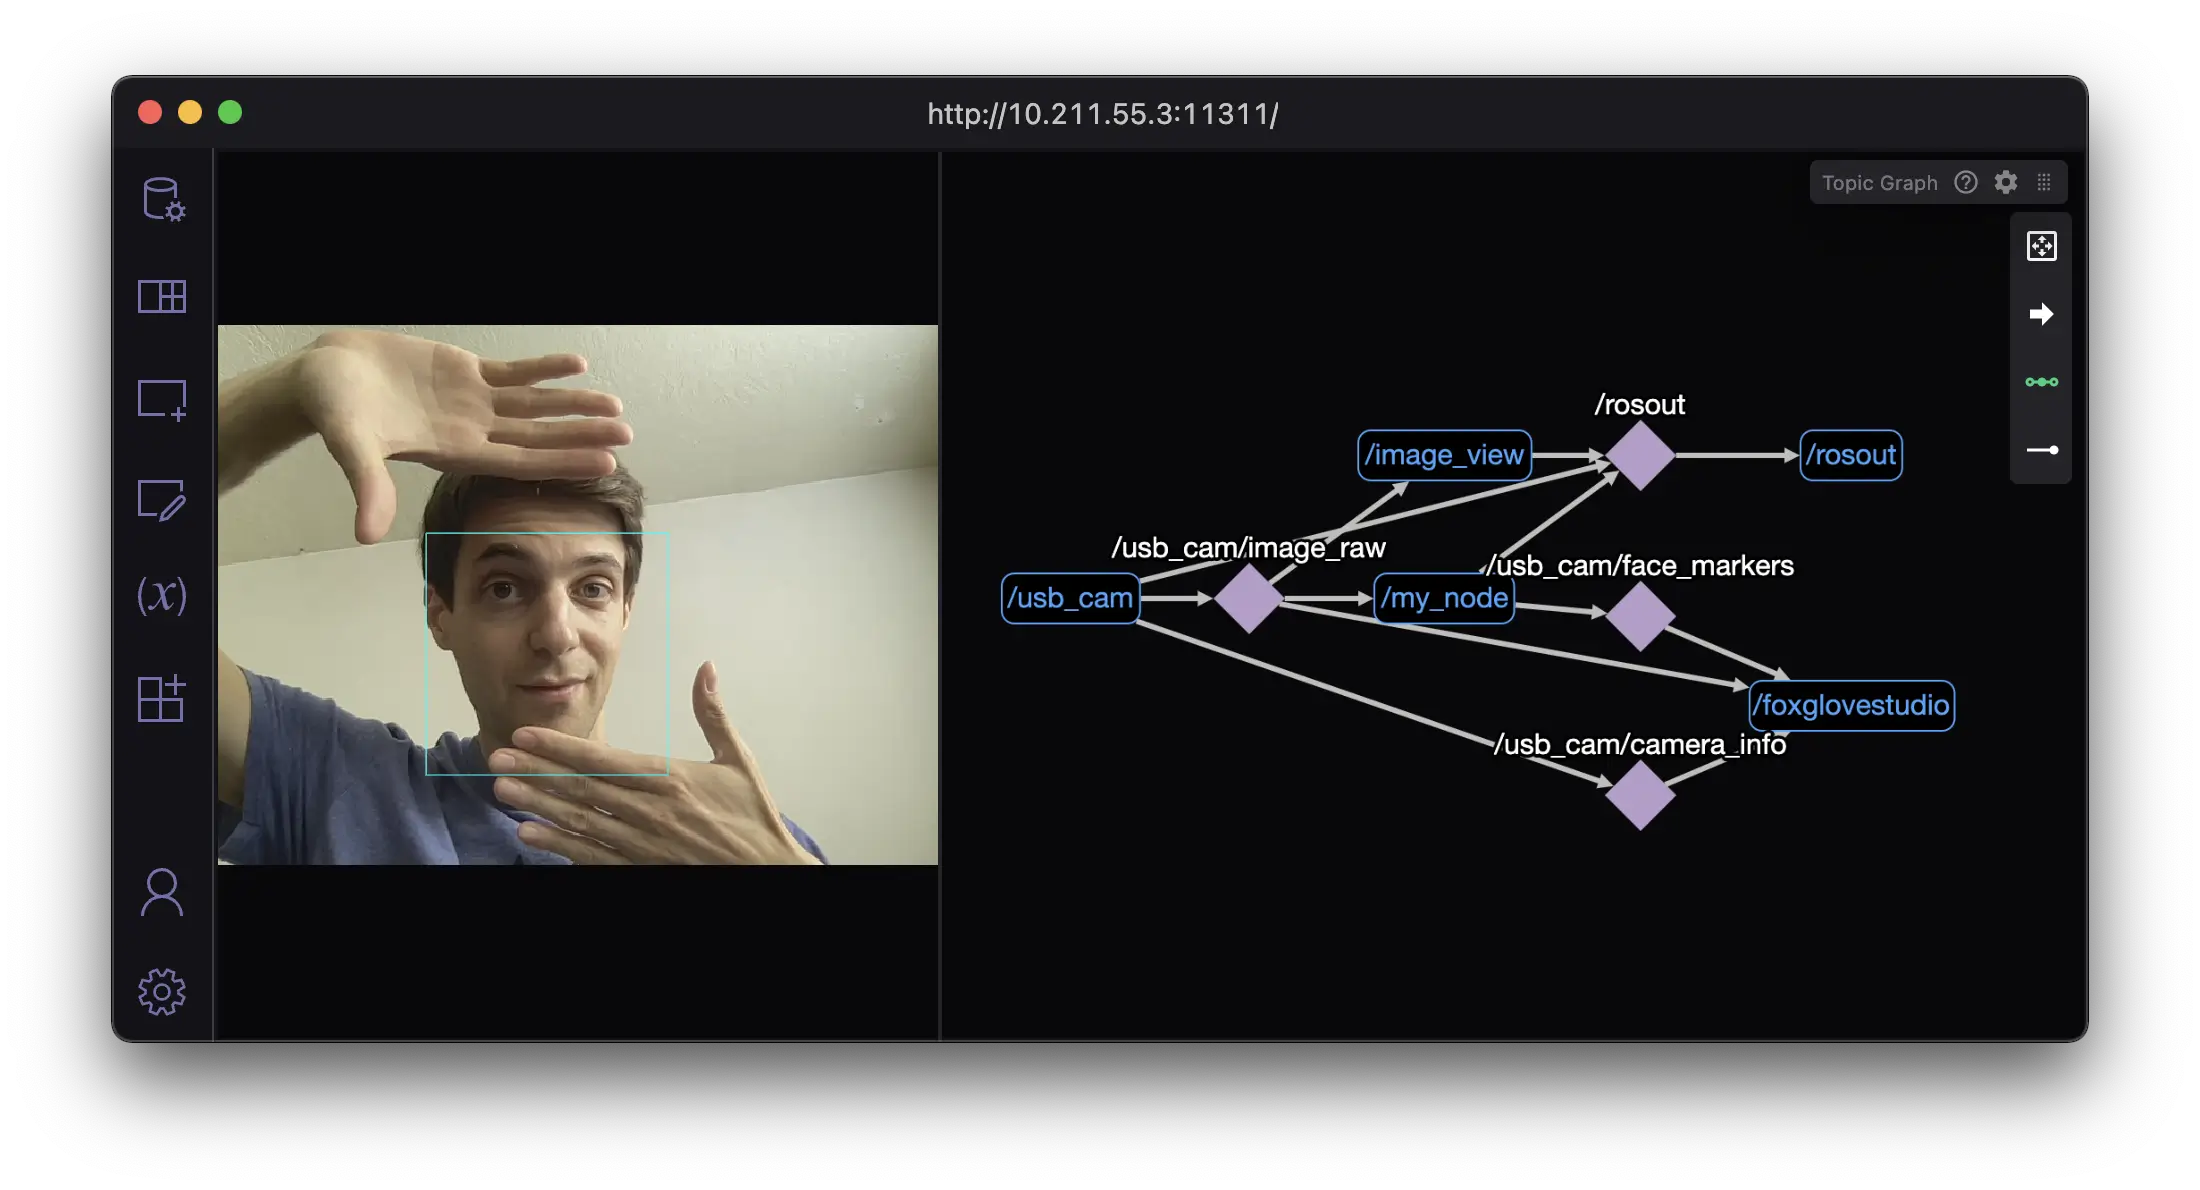
Next we’ll create a new layout, add an Image panel, and display the /usb_cam/image_raw topic:
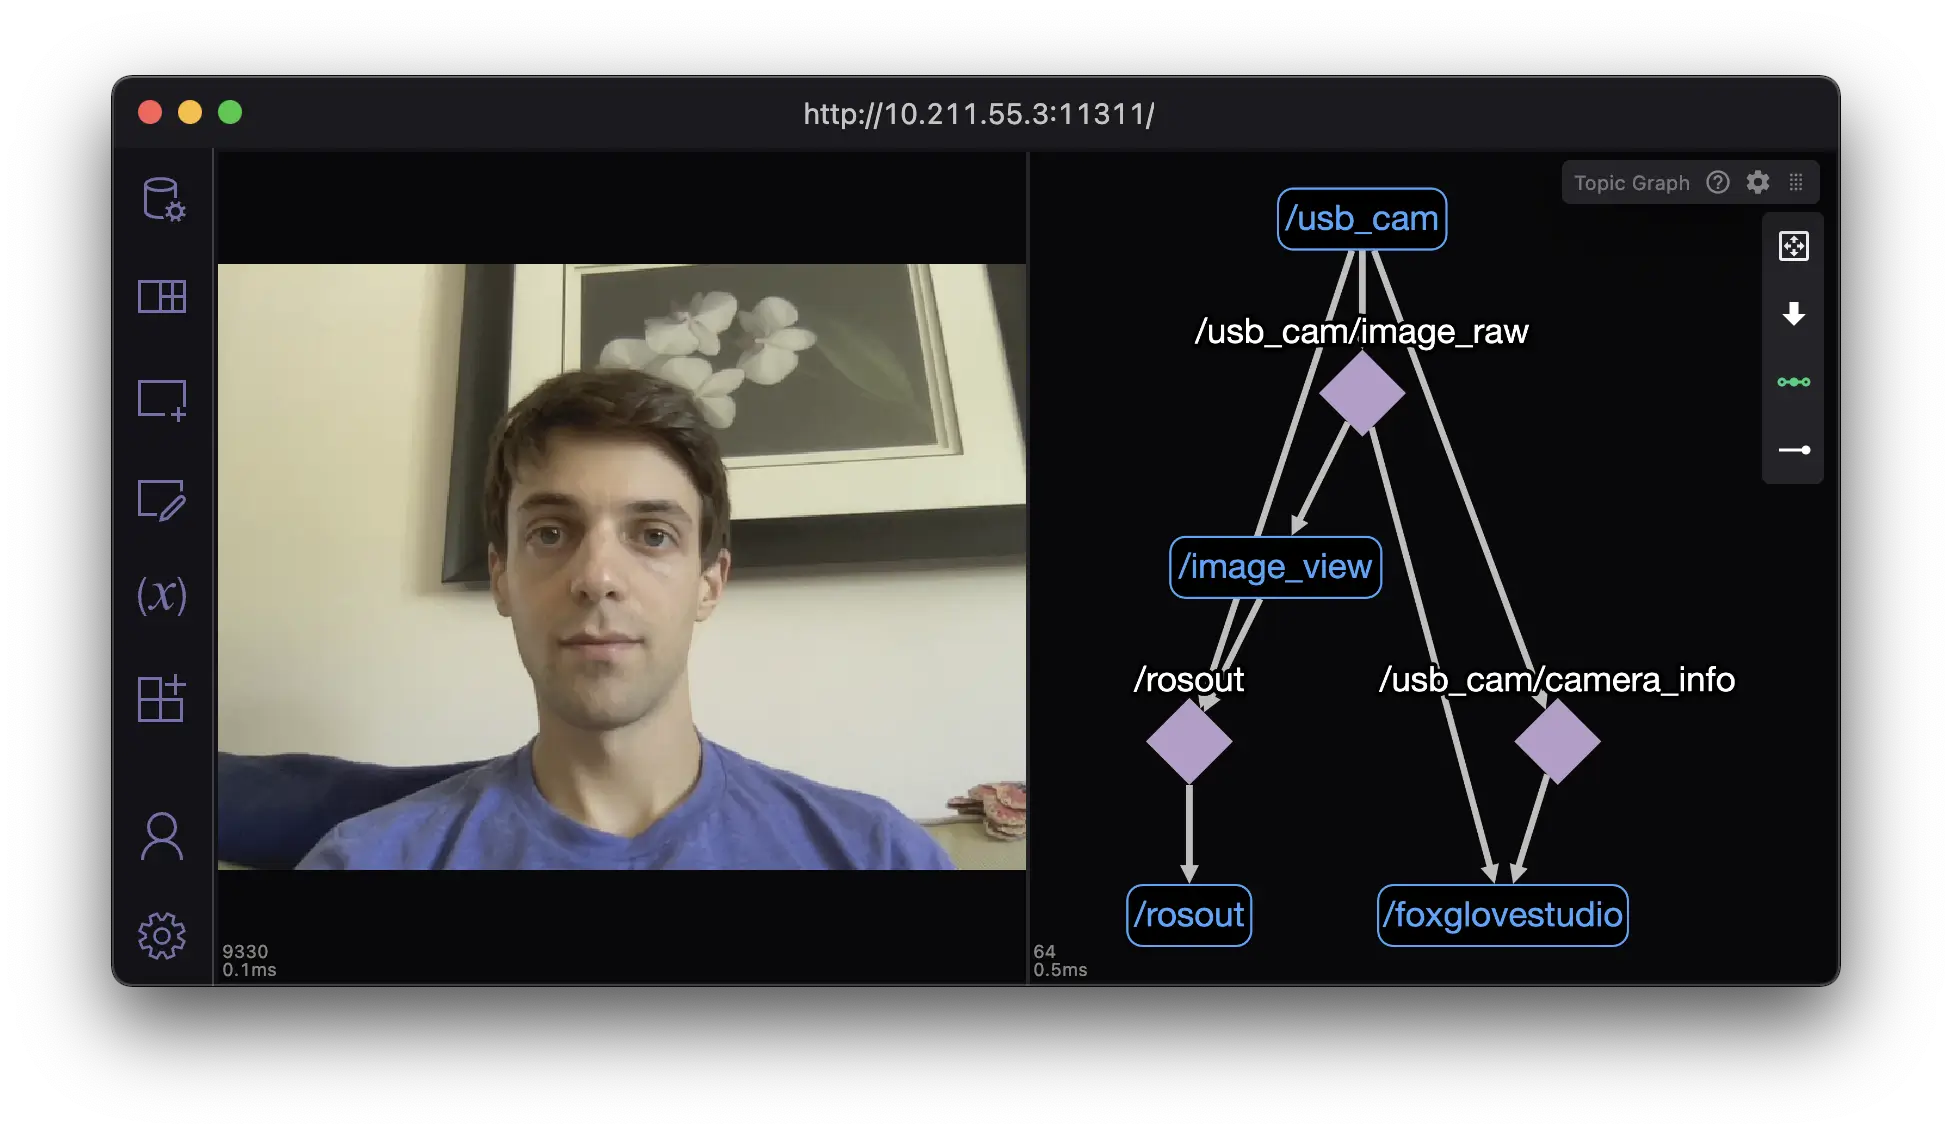
Let’s also open up a Topic Graph panel to visualize the flow of data in the system. Here, blue rectangles represent nodes, and pink diamonds represent topics. You can see how raw images, camera parameters, and log messages flow between the /usb_cam driver node, the /image_view window, and of course Foxglove itself.
Creating an image processor node in Python
Now that we’ve set up a camera and understood how data flows between nodes in the graph, we can begin processing images. We’ll use rospy to write a simple ROS node in Python.
First, let’s set up a node to receive camera images from the driver in a new my_node.py file:
import rospy
from sensor_msgs.msg import Image
def image_callback(msg: Image):
   rospy.loginfo("Got an image!")
def main():
   rospy.init_node("my_node")
   rospy.Subscriber("/usb_cam/image_raw", Image, image_callback, queue_size=1)
   rospy.spin()
if __name__ == "__main__":
   main()
Make sure roslaunch usb_cam usb_cam-test.launch is still running, before running your script in a new terminal window:
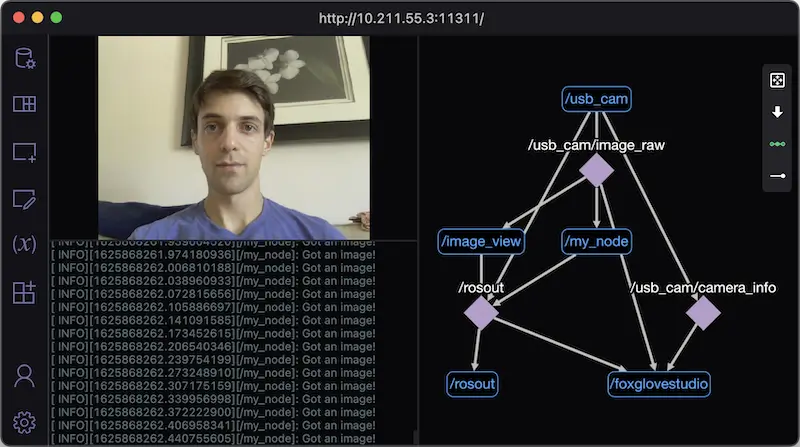
$ python3 my_node.pyBy adding a Log panel to our current layout, we can view the output from rospy.loginfo directly in Foxglove. We can also confirm that /my_node has appeared in the graph, and is receiving data from /usb_cam/image_raw.
The next step is detecting faces! We’ll use a library called Dlib, which provides a face detector out of the box:
$ pip3 install dlibWe can call dlib.get_frontal_face_detector() to create a face detector. The face detector only accepts grayscale images as input, so when we receive an image in our image_callback, we’ll first use cv_bridge to convert it to an OpenCV image, then convert that to grayscale using cvtColor.
import cv2
import dlib
from cv_bridge import CvBridge
cv_bridge = CvBridge()
face_detector = dlib.get_frontal_face_detector()
Finally, we’ll run the face detector, which returns a list of rectangles where faces were found. The callback logs a message indicating how many faces were detected — moving your face around on camera should affect the node’s output in the Log panel.
def image_callback(msg: Image):
   # Convert the ROS Image to a grayscale OpenCV image
   cv_img = cv_bridge.imgmsg_to_cv2(msg)
   grayscale_img = cv2.cvtColor(cv_img, cv2.COLOR_BGR2GRAY)
   # Run the face detector on the grayscale image
   rects = face_detector(grayscale_img, 0)
   rospy.loginfo(f"Detected {len(rects)} faces")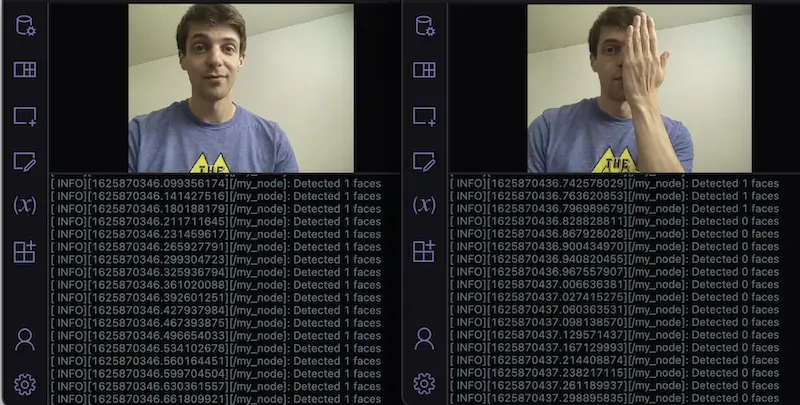
Now that we’ve determined whether a camera image contains faces, let’s use image markers to see where these faces were detected.
Adding image markers
ROS provides a message called ImageMarker, which describes a visual annotation on an image. Since we might have a variable number of faces in the image, we’ll need an array of markers. This isn’t provided by default with ROS, but Foxglove has created our own ImageMarkerArray schema. You can install it by running:
$ sudo apt install ros-noetic-foxglove-msgsNow let’s update our code to publish an image marker for each face in the image! We’re going to publish a new topic called /usb_cam/face_markers. (We use the same /usb_cam namespace prefix as the camera driver to indicate that the face markers use the same coordinate space as the camera driver’s images.)
In order to do this, we need to reorganize our code a little bit, moving the subscriber and publisher into a class so they can share state via self.
from std_msgs.msg import ColorRGBA
from foxglove_msgs.msg import ImageMarkerArray
from visualization_msgs.msg import ImageMarker
from geometry_msgs.msg import Point
class Node:
   pub_markers: rospy.Publisher
   def __init__(self):
      rospy.init_node("my_node")
      rospy.Subscriber("/usb_cam/image_raw", Image, self.image_callback, queue_size=1)
      # On initialization, set up a Publisher for ImageMarkerArrays
      self.pub_markers = rospy.Publisher(
          "/usb_cam/face_markers", ImageMarkerArray, queue_size=1
      )
      rospy.spin()
Then in our image_callback, we’ll publish an ImageMarkerArray every time we receive an image from the camera:
markers = ImageMarkerArray()
for rect in rects:
   markers.markers.append(
       # Display each face as a cyan rectangle
       ImageMarker(
           header=msg.header,
           scale=1,
           type=ImageMarker.POLYGON,
           outline_color=ColorRGBA(0, 1, 1, 1),
           points=[
               Point(rect.left(), rect.top(), 0),
               Point(rect.right(), rect.top(), 0),
               Point(rect.right(), rect.bottom(), 0),
               Point(rect.left(), rect.bottom(), 0),
           ],
       )
   )
self.pub_markers.publish(markers)
Finally, we’ll add Node() to our def main().
Back in Foxglove, the Image panel now shows our new topic in the dropdown menu under “markers”.
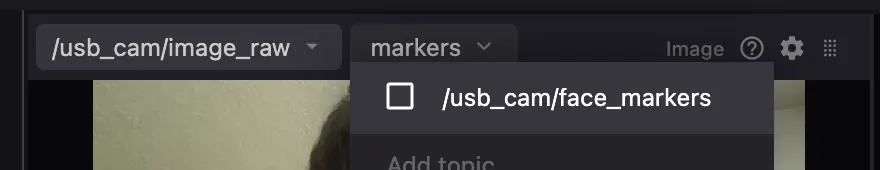
When I turn it on, a box appears around my face — the detector is working! The /usb_cam/face_markers topic also appears in the graph.
Predicting facial features
Let’s take it one step further. Not only does Dlib provide a face detector — it also provides a facial landmark predictor, which understands the location of several common points on a face. To use it, we’ll need a trained model file, which you can download from this link here (99MB decompressed). Information about the model is provided in the imutils package, so let’s install that too.
$ wget http://dlib.net/files/shape_predictor_68_face_landmarks.dat.bz2
$ bunzip2 shape_predictor_68_face_landmarks.dat.bz2
$ pip3 install imutils
We can initialize the predictor with dlib.shape_predictor(), passing it the path to the data file we just downloaded and extracted.
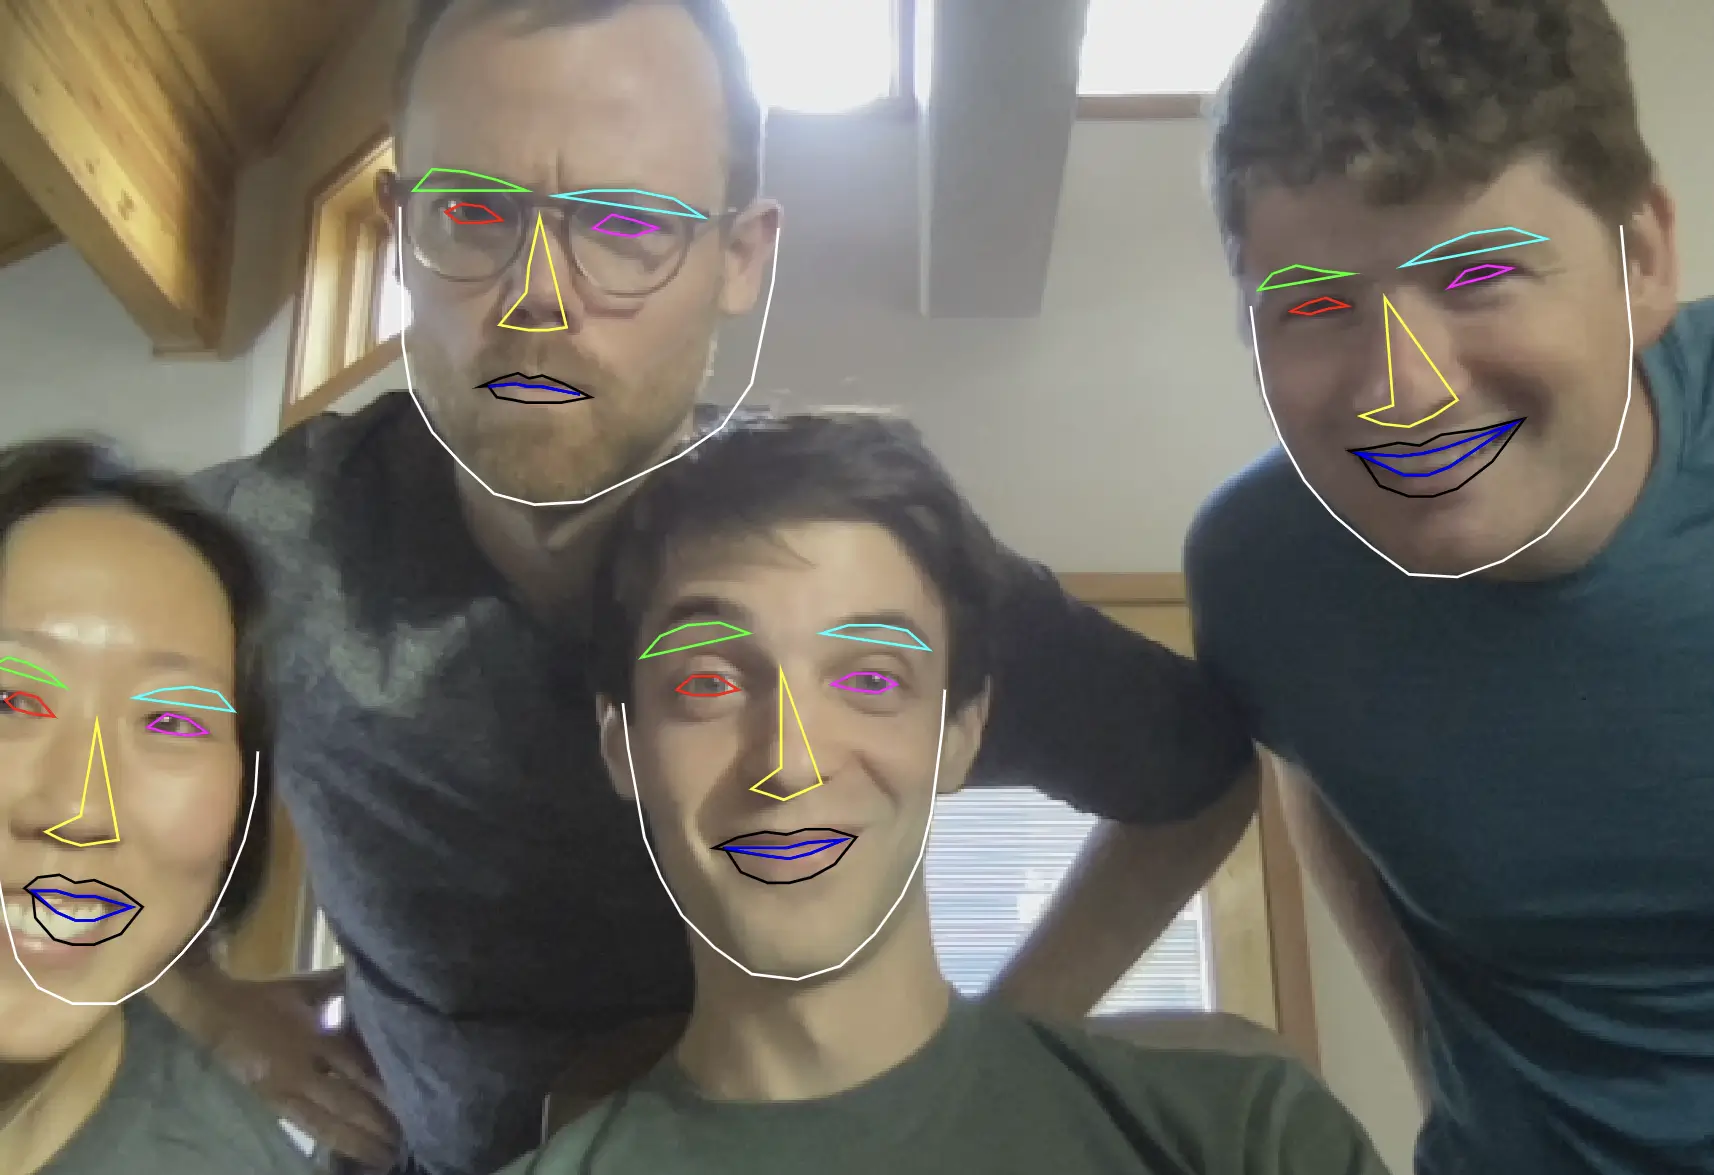
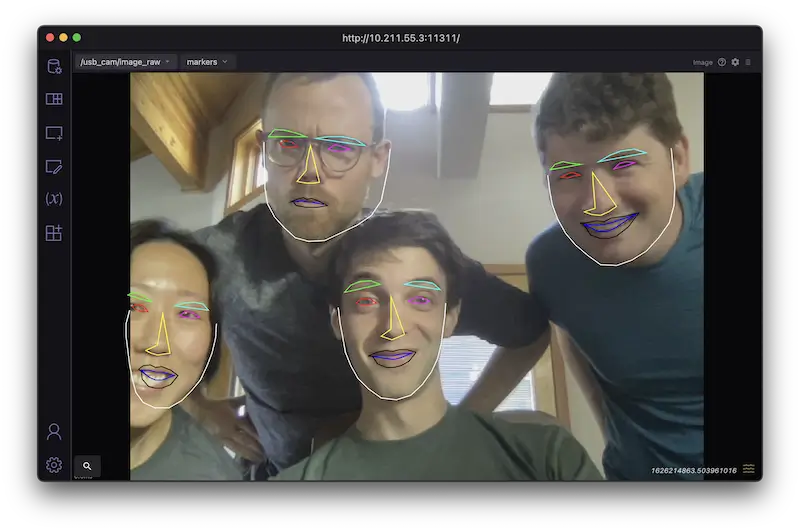
Once we’ve detected a face is present in a rectangular region, we’ll run the predictor on that region to get a series of 68 points. Then we’ll interpret those points using imutils.face_utils.FACIAL_LANDMARKS_68_IDXS, which groups them into 8 facial features (mouth, inner_mouth, right_eyebrow, left_eyebrow, right_eye, left_eye, nose, and jaw).
from imutils.face_utils import FACIAL_LANDMARKS_68_IDXSWe’ll upgrade our image markers by drawing a line of a unique color for each facial feature.
predictor = dlib.shape_predictor("shape_predictor_68_face_landmarks.dat")
COLORS = [
  ColorRGBA(0, 0, 0, 1),
  ColorRGBA(0, 0, 1, 1),
  ColorRGBA(0, 1, 0, 1),
  ColorRGBA(0, 1, 1, 1),
  ColorRGBA(1, 0, 0, 1),
  ColorRGBA(1, 0, 1, 1),
  ColorRGBA(1, 1, 0, 1),
  ColorRGBA(1, 1, 1, 1),
]
Then, in our image_callback:
for rect in rects:
   # Run the predictor, which returns a list of 68 facial landmarks as (x,y) points
   points = predictor(grayscale_img, rect).parts()
   # Draw a line around each face region
   for region_idx, (name, (start_idx, end_idx)) in enumerate(
       FACIAL_LANDMARKS_68_IDXS.items()
   ):
       # Connect the points for each region in a loop, except for the jaw
       type = ImageMarker.LINE_STRIP if name == "jaw" else ImageMarker.POLYGON
       markers.markers.append(
           ImageMarker(
               header=msg.header,
               scale=1,
               type=type,
               points=[Point(p.x, p.y, 0) for p in points[start_idx:end_idx]],
               outline_color=COLORS[region_idx % len(COLORS)],
           )
       )
And that’s all for this tutorial — thanks for following along! Now that your robot can analyze images, and you can visualize the results with image markers, I hope it will be easier for you to add amazing new functionality to your robot.
Full sample code for this post is available on GitHub.
For more information, see the following reference materials:
usb_camdocumentation- Dlib documentation
- Detect eyes, nose, lips, and jaw with dlib, OpenCV, and Python by Adrian Rosebrock
If you have questions or just want to chat about robotics visualization, join us in our Discord community.