Compare robot recordings across runs
Comparison Mode puts every data source on one shared timeline, aligned and labeled.

You have two recordings and one question: what changed? Did the fix work, or did the failure just not happen this time? Or maybe you want to see how a behavior you meticulously tuned in sim performs on real hardware. Finding these answers today means scrubbing in separate windows, holding several timelines in your head while you squint to see whether the velocity spike lines up with the state change. Plenty of teams give up and resort to exporting CSVs, spending an afternoon in a notebook cleaning data and lining runs up by hand.
Today, as part of our agentic data platform for Physical AI, we are introducing Comparison Mode to make robot run comparisons easier within the same tool you use to visualize and debug individual runs.
What does Comparison Mode do for you?
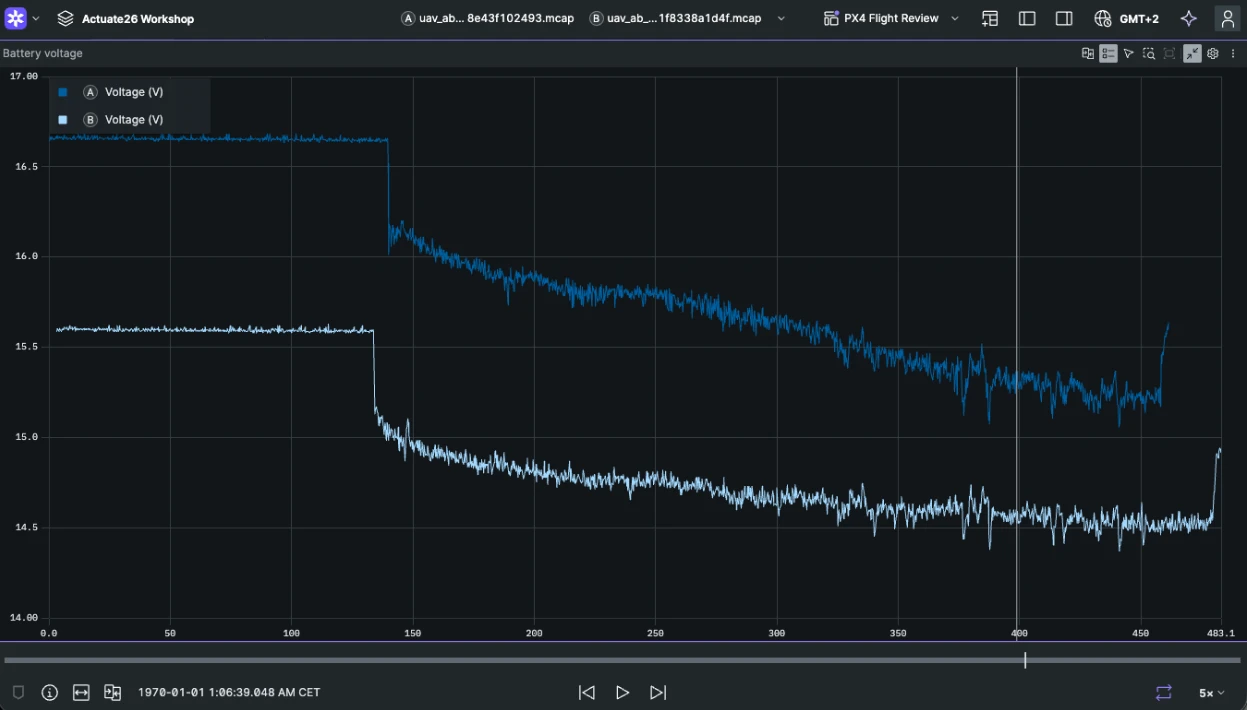
Using Comparison Mode, you can load any number of data sources onto a shared timeline, each in a labeled slot: A, B, C, and so on. You can view these sources together, overlaid or side by side.
Playing data from multiple sources on a shared timeline can be useful in many scenarios. Here are some examples:
Validate fixes by comparing pre- and post-fix runs
Compare two runs of the same scenario, before and after a code change. Visualizing side by side on a timeline makes it easy to verify whether the fix actually worked.
Separate hardware faults from software regressions in fleets
Load recordings from several robots or missions and easily find data outliers pointing toward mechanical issues.
Measure the sim-to-real gap
Compare a simulated run against a real one. Manually adjust the clock offset to a common starting point and look at the difference between the two runs by comparing 3D output, plotted values, or diagnostics side by side.
Track degradation by comparing sessions weeks apart
You can compare two sessions of continuous operation, each spanning several recordings. Slow degradation that stays hidden inside one session becomes visible once two shifts recorded weeks apart share a timeline.
Isolate failure modes by comparing repeated events
You can open every safety stop in a time range. Each event anchors at zero, so the instance that doesn’t match the others is easy to spot.
Try Comparison Mode
This feature is available today to all customers. You can try it from within the web app or the desktop app. Just go to any of the data-listing pages (Recordings, Sessions, Events), choose more than one item, then select “Compare”. Learn about Comparison Mode.
Our engineers will demo these features live on September 2, 2026. Register now.