Foxglove vs. RViz.
How Foxglove compares to RViz, the original visualization tool for ROS.


What is RViz?
RViz (ROS Visualization) is an open-source 3D visualization tool within the Robot Operating System (ROS), for visualizing a robot’s sensor data, state, and environment. It helps developers by displaying data from cameras, lidar, radar, and other sensors while visualizing robot models and joint states within the ROS ecosystem. Integrated with ROS topics, it streams real-time data, enabling interactive debugging and testing. RViz remains a good starting point for hobbyists and first-timers becoming familiar with ROS.
When a roboticist encounters Foxglove, it’s natural to draw comparisons to RViz, a longstanding data visualization tool many have relied on for debugging live ROS data. In fact, a significant number of Foxglove users transitioned from RViz to Foxglove to enhance and scale their workflows. So, why consider Foxglove when RViz may already feel familiar? The answer lies in understanding the similarities, the differences, and what Foxglove brings to the table.
What is Foxglove?
Foxglove is more than a multimodal data visualization tool—it’s a comprehensive platform purpose-built for robotics and embodied AI development. Supporting diverse data formats like MCAP, ROS, Protobuf, and JSON, Foxglove seamlessly facilitates live and recorded data analysis through over 20 visualization panels. It fosters collaboration with shareable layouts and extensible customization, empowering teams to work efficiently. Additionally, Foxglove simplifies uploading, streaming, organizing, and managing petabytes of data. Whether debugging complex 3D interactions, analyzing time-series data, or managing multimodal datasets, Foxglove delivers a modern, flexible, and robust solution designed to meet the challenges of robotics development.
Specifically for ROS.
Foxglove supports both ROS 1 and ROS 2, ensuring compatibility regardless of the ROS version your project uses. It connects to ROS environments seamlessly, enabling real-time visualization of data from ROS topics, services, and parameters without additional setup or middleware.
Easily connect to your ROS data with the native Foxglove_bridge, a high-performance C++ node that seamlessly links ROS stacks to Foxglove via WebSocket. With minimal overhead, it supports both ROS 1 and ROS 2 for smooth integration.
Foxglove makes it easy to load and visualize data from ROS bag files, which are used to record and replay ROS data. Developers can replay bag files in Foxglove to analyze historical data, debug issues, or validate system performance. This capability is invaluable for diagnosing problems that occur in the field. Load files effortlessly by dragging and dropping a bag file, double-clicking, or selecting “Open local file.”
“It fills a longstanding gap in the ROS ecosystem.” Mirza A. Shah, CTO and Co-founder, Simbe
The similarities between RViz and Foxglove.
3D scene visualization.
Iterating on a robot becomes significantly easier when you can clearly visualize what it perceives and how it operates in a 3D space. While debugging “two-dimensional data” through plots and logs is relatively straightforward, understanding 3D data purely from numeric outputs is nearly impossible. Tools like RViz and Foxglove bridge this gap by providing rich 3D visualization environments, making it possible to see the world as the robot does.
Both RViz and Foxglove allow you to display sensor data like camera images, laser scans, and point clouds, as well as state information such as tracked objects, planned trajectories, and system health. Additionally, they support visualization markers—labels, bounding boxes, and 3D models—that highlight key points of interest. Together, these tools create a comprehensive 3D scene that shows what the robot perceives in its environment, how it predicts changes, and how it plans to navigate and perform tasks. This level of insight enables roboticists to assess their robot’s current effectiveness and identify opportunities for improvement, driving faster and more informed iterations.
Customization and extensibility.
Both RViz and Foxglove allow you to fully customize your visualizations, giving you control over how markers appear and enabling you to adjust attributes like size, shape, and color. In Foxglove’s 3D panel, you can configure visualization settings on a per-topic basis, offering an intuitive and granular way to tailor your data representation.
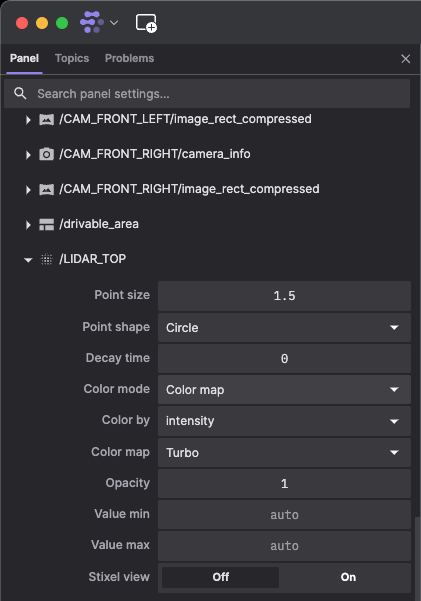
The Foxglove 3D panel provides visualization settings per displayed topic.
Additionally, both tools support user-contributed extensions, enabling you to expand functionality to meet specific needs. In RViz, you can create plugins in C++ that require compilation and installation. Meanwhile, Foxglove provides a more accessible approach, allowing you to develop custom panel extensions using HTML and JavaScript, which you can easily add to your local Foxglove instance and share in the extensions registry. This extensibility ensures that robotics companies can build bespoke tools to further benefit from the RViz or Foxglove, empowering teams to address their unique challenges effectively.
The differences between RViz and Foxglove.
The scope of visualization.
Out of the box, RViz focuses on visualizing your robot’s environment primarily through camera images and 3D markers, offering a 3D view tailored for ROS users. However, to address other use cases like logging outputs or plotting temporal data, you’ll need additional tools within the ROS ecosystem, such as rqt_multiplot, rqt_runtime_monitor, and rqt_graph. While these tools complement RViz, they require separate installation, learning, and usage.
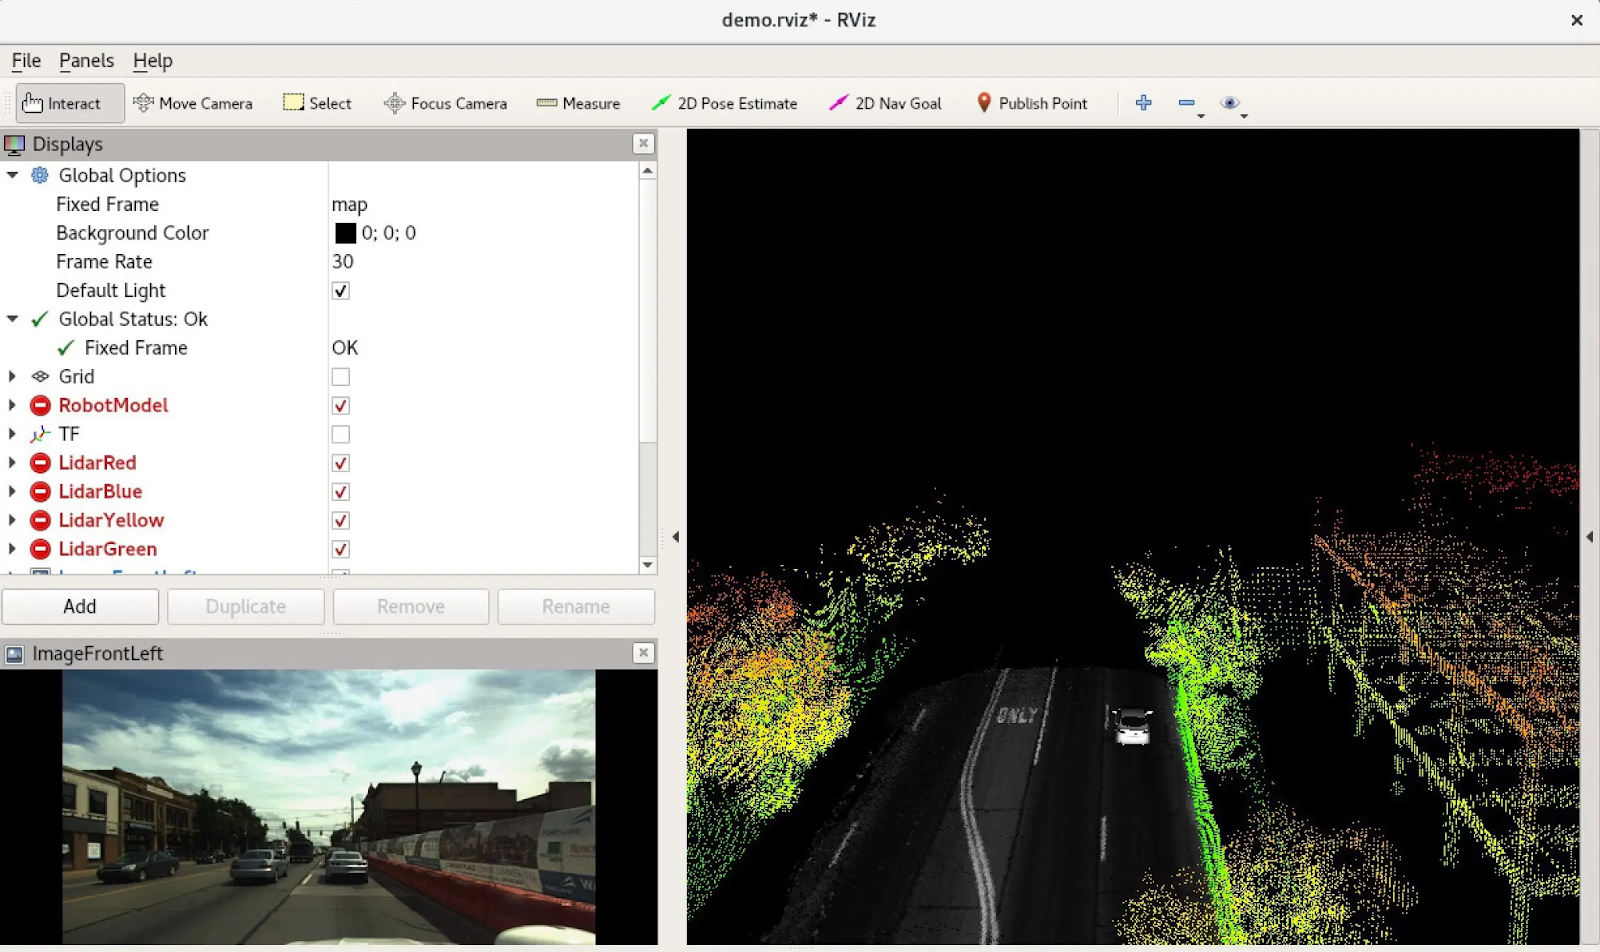
The RViz UI displays a robot’s camera images and an annotated 3D scene.
The RViz UI displays a robot’s camera images and an annotated 3D scene.
Foxglove, in contrast, consolidates many visualization tools into a single, cohesive environment through customizable panels. These panels are not only integrated into one workspace but are also highly flexible, allowing users to design layouts tailored to specific workflows. Instead of piecing together multiple tools, Foxglove provides a unified platform that simplifies debugging and data analysis.
Foxglove’s Image and 3D panels together encompass the core functionality of RViz and offer extended compatibility and functionality (e.g.: support for H.264, H.265, VP9, and AV1 video codecs). The Image panel displays your robot’s camera feeds, while the 3D panel integrates all available sensor data, camera feeds, and visualization markers into an interactive 3D scene. With support for a wide range of markers and message types, the 3D panel ensures comprehensive visualization of your robot’s perception and operations.
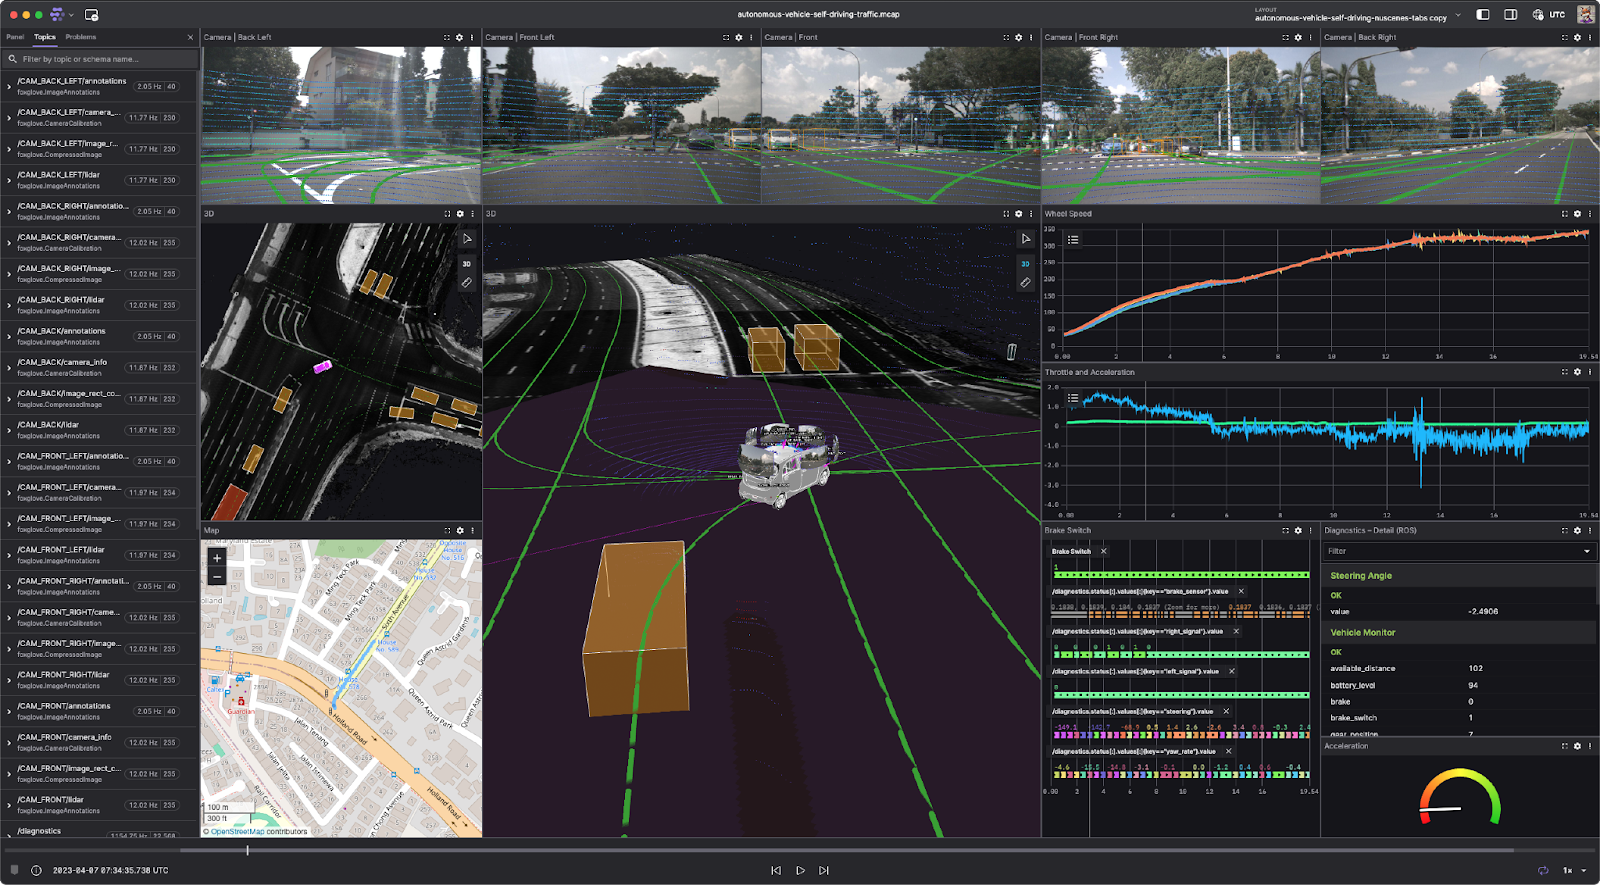
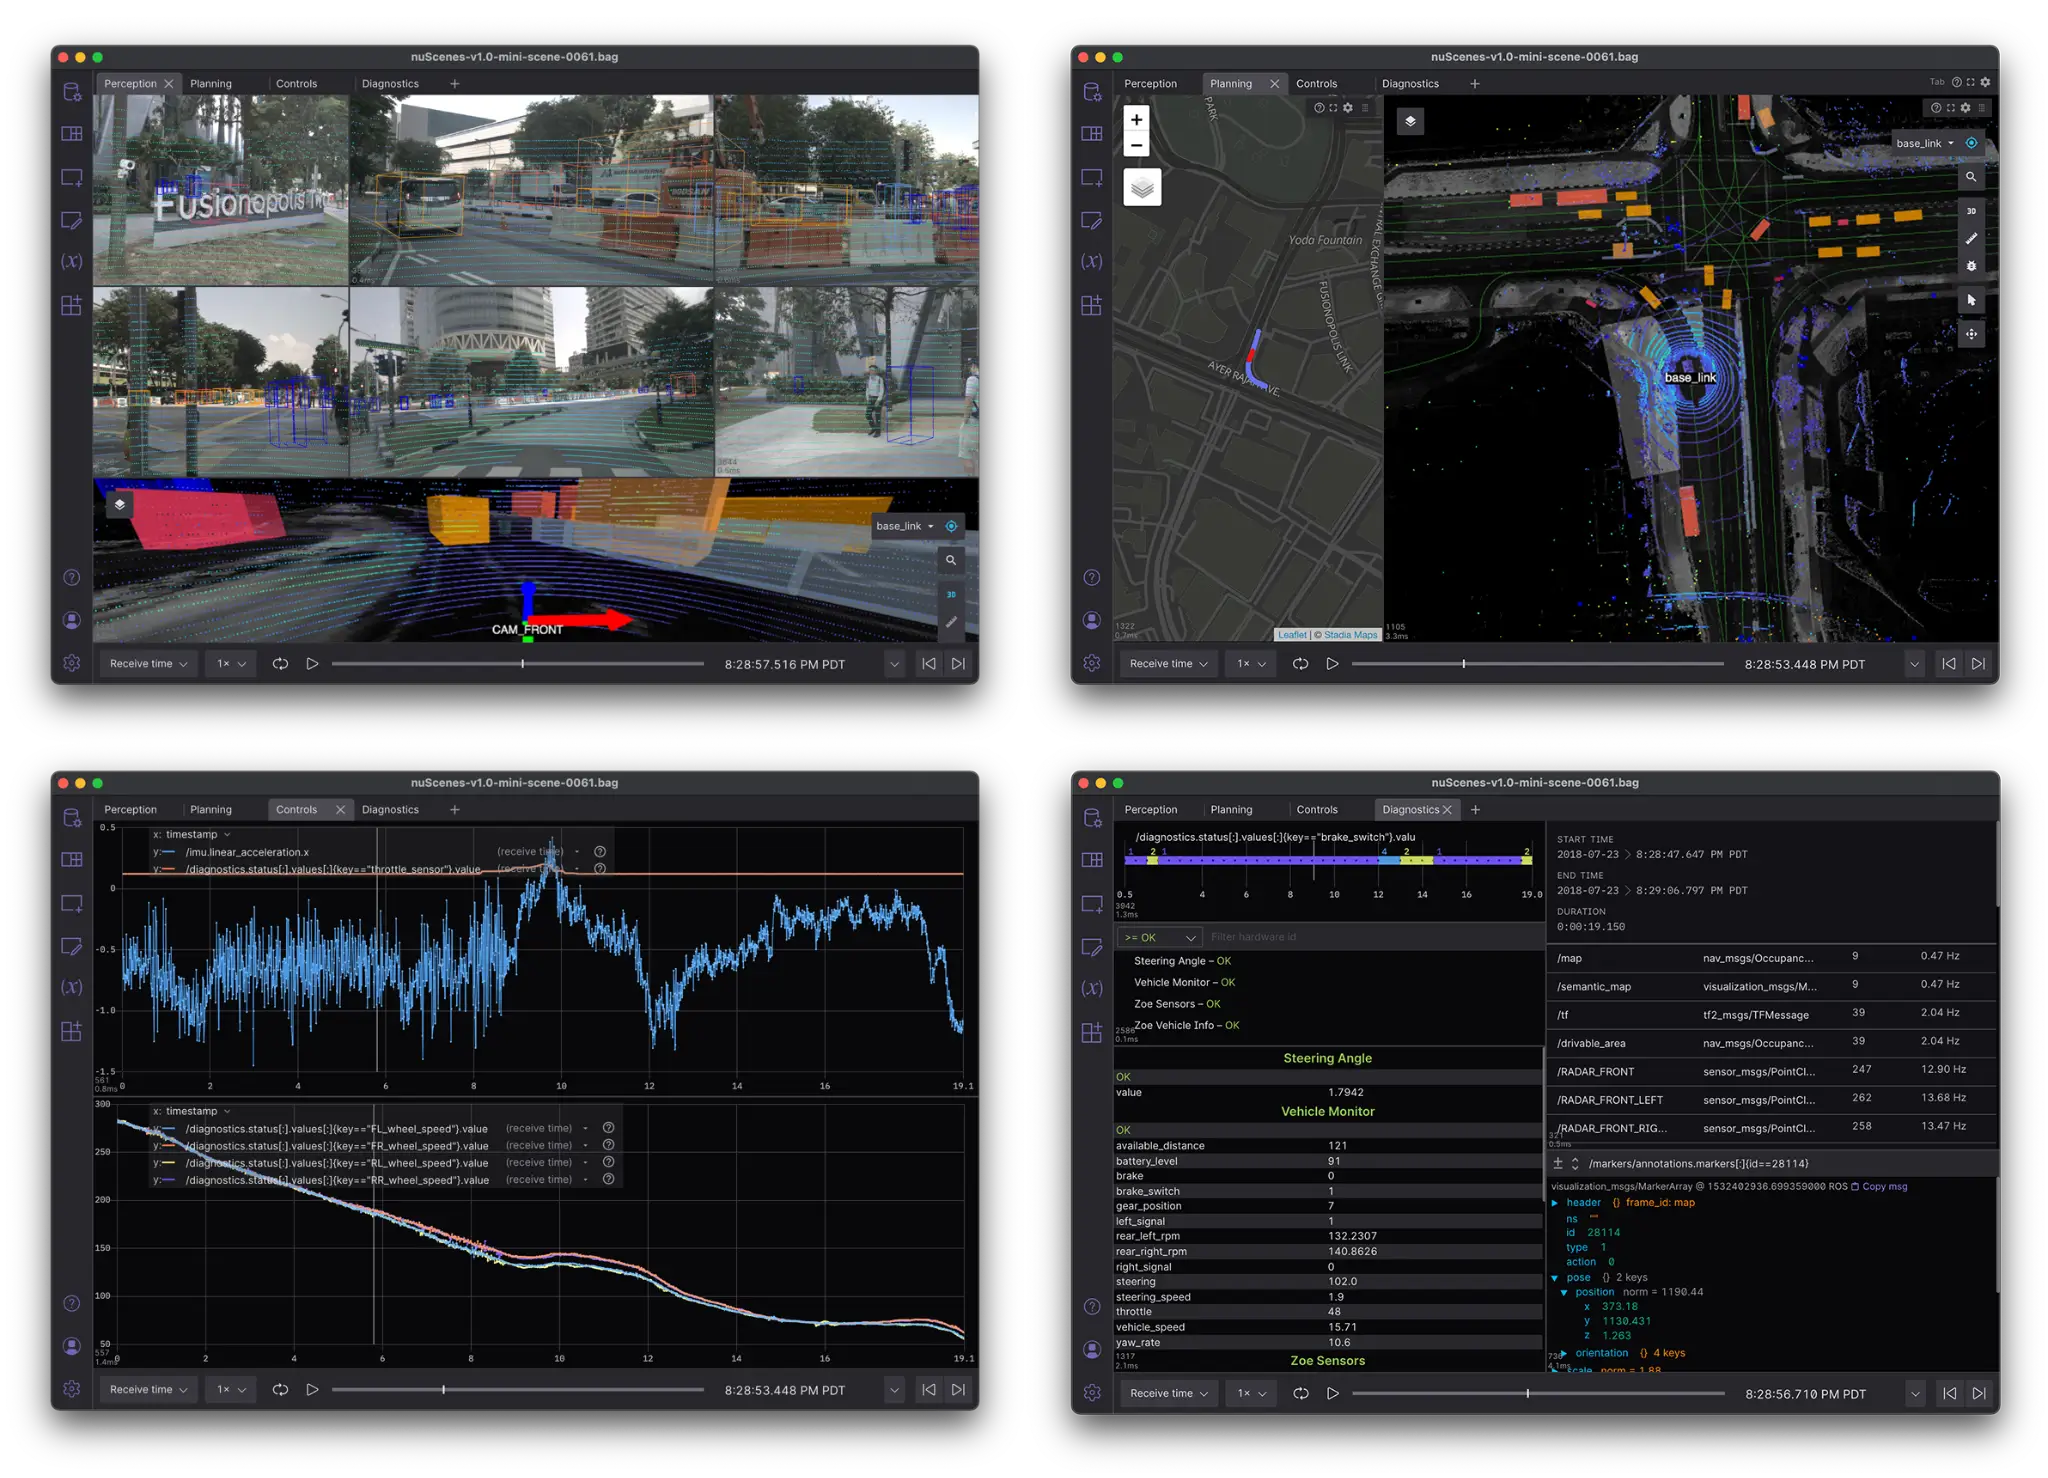
The Foxglove UI displays camera images, annotated 3D scenes, temporal and geospatial data, and so much more.
The Foxglove UI displays camera images, annotated 3D scenes, temporal and geospatial data, and so much more.
Beyond these, Foxglove offers more than 20 out of the box panels like the Diagnostics (ROS) Panel to easily display the status of nodes and the Plot and State Transitions panels, which extends the functionality of ROS’s rqt_plot, allowing you to chart temporal data effortlessly. Furthermore, Foxglove lets you save and switch between pre-designed layouts with a single click, streamlining workflows by eliminating the need to manually rearrange multiple tools each time. This integration makes Foxglove a versatile and powerful alternative for visualizing and analyzing robotics data.
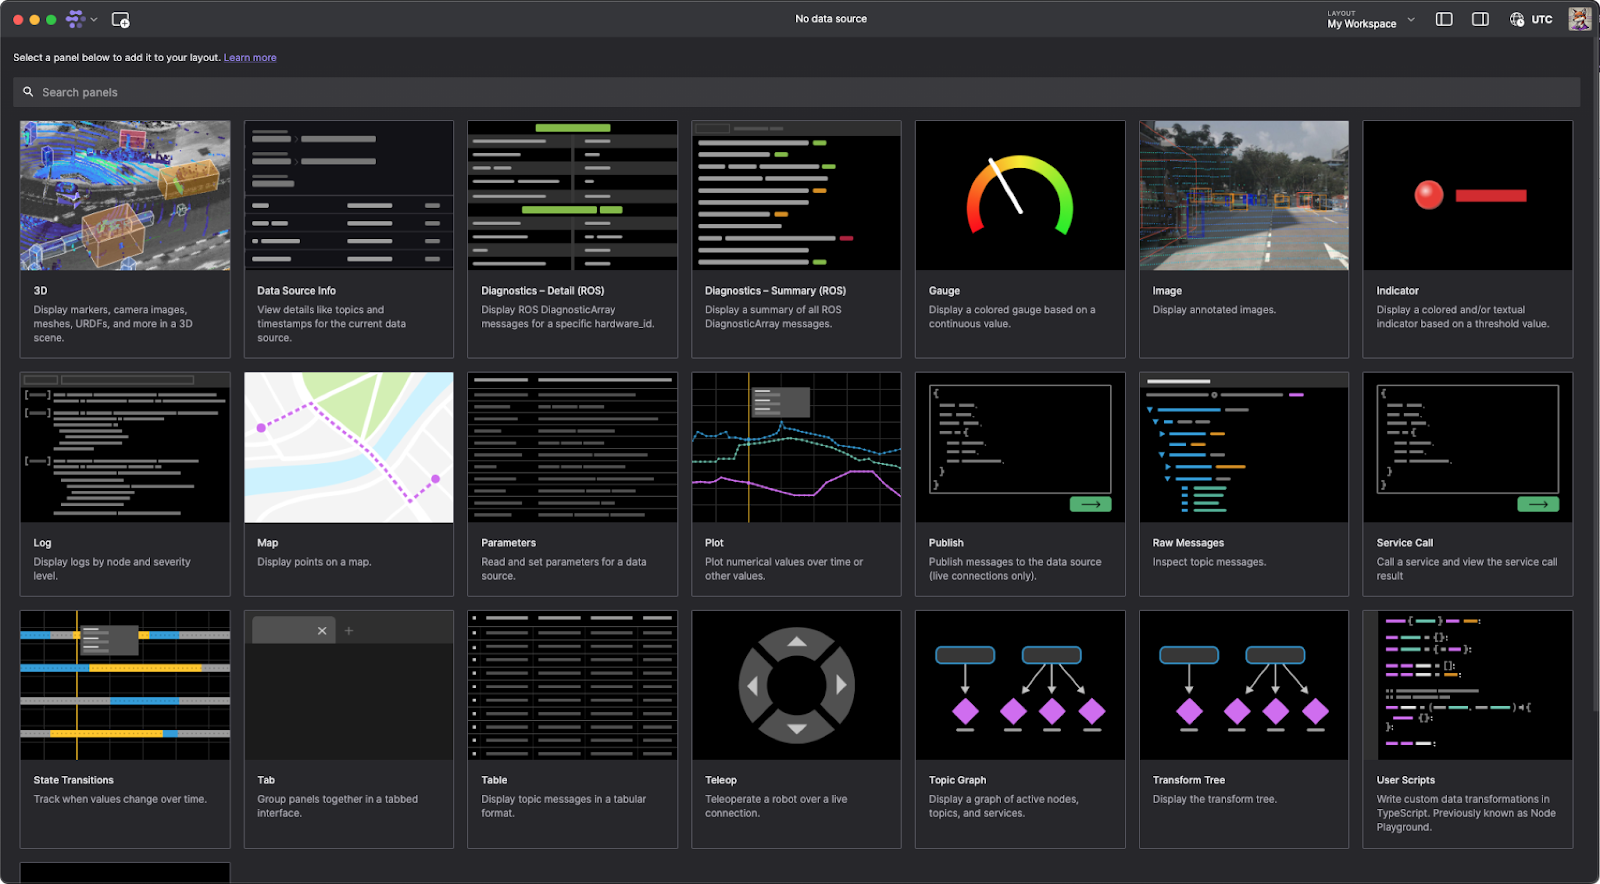
Foxglove displays more than 20 out of the box panels to choose from.
File playback.
RViz lacks the built-in capability to play back .bag files. To visualize ROS data in RViz, you must use an external CLI tool like rosbag (for ROS 1) or ros2 bag (for ROS 2) to play the desired file, adding an extra layer of complexity to the workflow.
In contrast, Foxglove simplifies this process significantly by offering seamless support for .bag, .db3, and .mcap file playback. You can load files—whether local or remote, for ROS 1 or ROS 2—directly from the Foxglove or simply drag and drop a local file into Foxglove to start playback immediately. Foxglove also supports merged playback of multiple local files as if they’re a single recording. Simply select Open local file(s), choose multiple files from your system, and view the combined data seamlessly.
Foxglove goes further with interactive playback controls, allowing you to adjust playback time, view timestamps in different formats, and scrub back and forth to specific moments effortlessly. This streamlined approach saves time and ensures an intuitive experience for exploring and analyzing your robotics data.
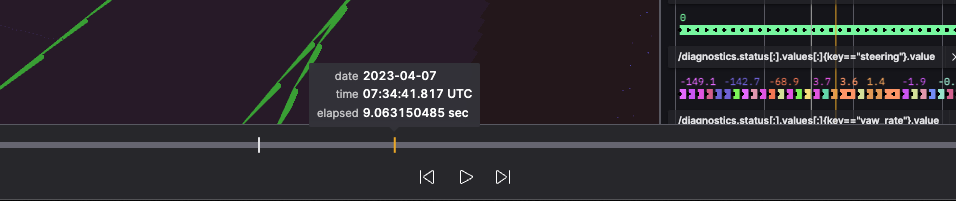
Foxglove playback controls.
Cross-platform compatibility.
RViz, as part of the ROS ecosystem, requires a properly installed and configured ROS environment. For machines not running one of the Tier 1 ROS-supported platforms, such as Ubuntu or Windows 10, you must rely on a virtual machine to set up your ROS environment. This extra layer of complexity makes connecting to your robots and accessing data significantly more challenging.
Setting up native ROS tools often involves hours of troubleshooting and meticulously configuring the environment to ensure compatibility. Foxglove eliminates this hassle by offering a user-friendly solution accessible in two ways: as a stand-alone web app and as a desktop application.
For quick access without downloading software, you can navigate to app.foxglove.dev in your browser. If you prefer the desktop app, installers are readily available for macOS, Windows, and Linux. Unlike RViz, Foxglove avoids dependency headaches and ensures you can start viewing and analyzing your robotics data within seconds, regardless of your setup.
Collaboration.
RViz is good for visualizing live robotics data as an individual developer or hobbyist, but it lacks built-in features for collaborative workflows or sharing debugging setups with a team. Beyond creating plugins that other RViz users can manually download, there are limited options for sharing your work or setups with others.
Like RViz plugins, Foxglove offers custom extensions that allow you to create unique visualizations tailored to your needs. These extensions can be shared through an extension registry, making it easy for users to find and implement custom solutions.
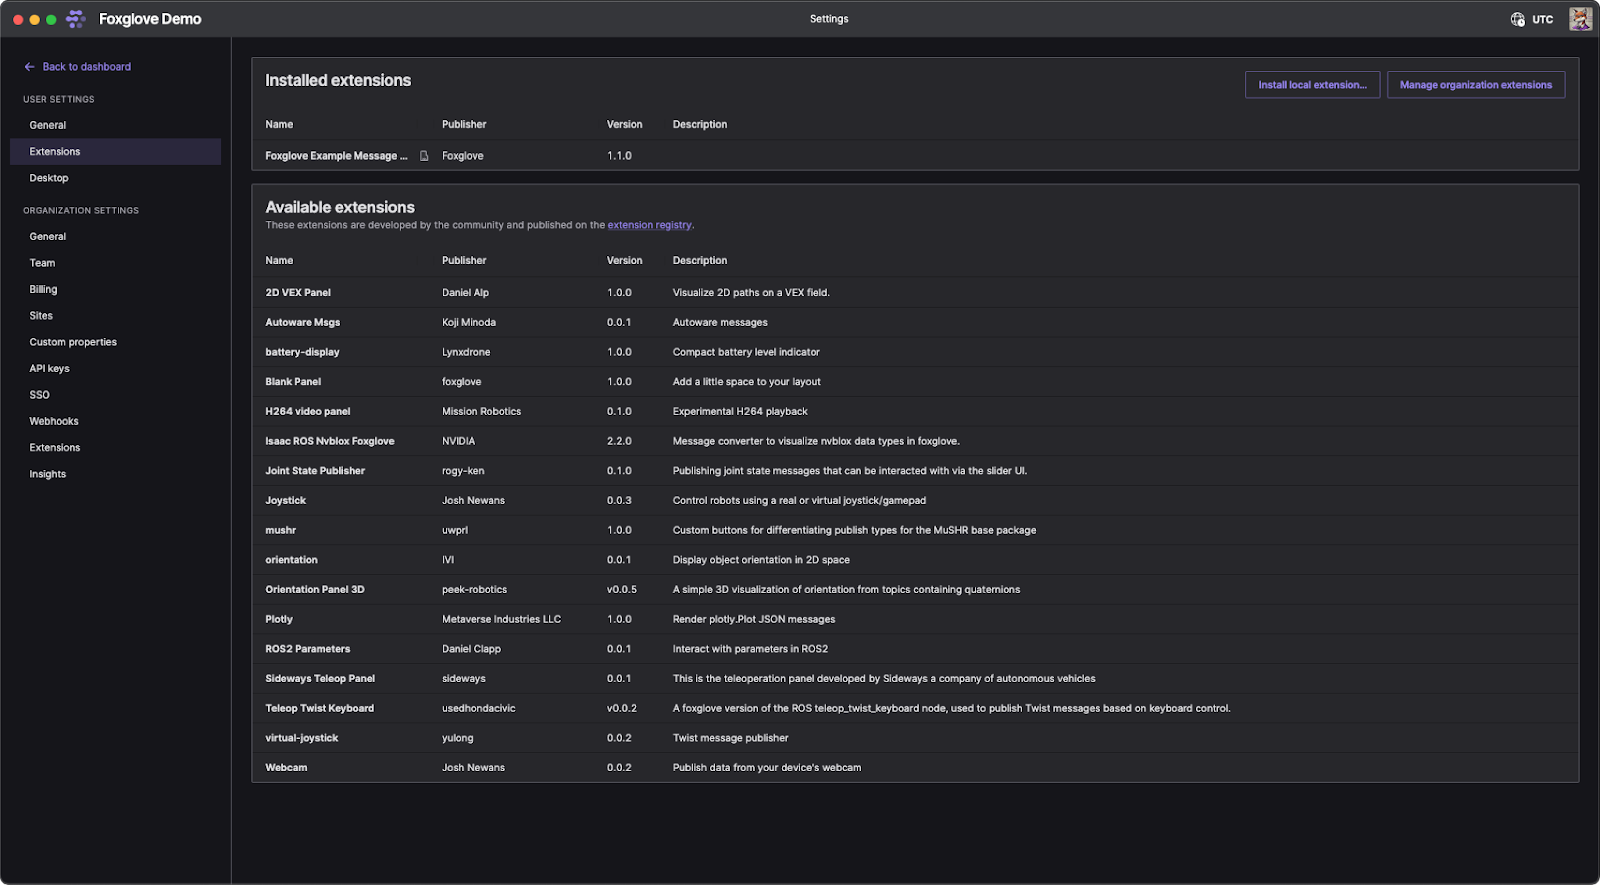
The Foxglove extensions registry.
The Foxglove extensions registry.
What sets Foxglove apart are its team-oriented features. Organization Layouts enable you to create, edit, and share your custom visualization layouts across your entire team. Additionally, Foxglove provides a central repository where team members can upload, access, and explore shared data. Teams can quickly locate events of interest and stream relevant data directly into visualizations for deeper analysis. This collaborative approach streamlines debugging and fosters more effective teamwork, making Foxglove a valuable tool for scaling your development.
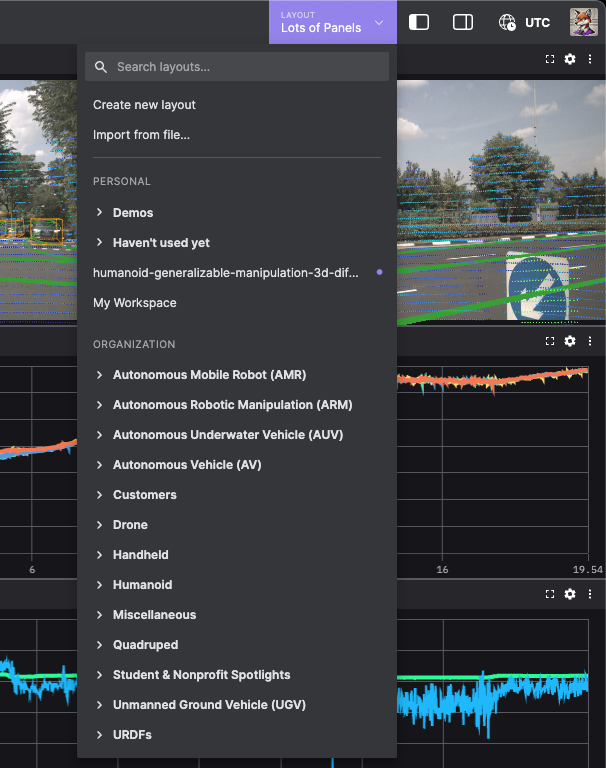
Foxglove’s layout organization and sharing.
Foxglove’s layout organization and sharing*.*
Data collection and ingestion.
RViz relies on the ROS ecosystem to record and access data, it does not have any data collection and ingestion capabilities. Foxglove streamlines data collection and management with the Foxglove Agent, enabling real-time or on-demand ingestion of recordings. Whether you’re importing data, uploading local files, or connecting to a live robot, the Foxglove Agent ensures seamless data serialization, transportation, and processing.
Foxglove handles asynchronous data streams from diverse sources or massive datasets with ease, indexing data by device, time, and topic for organized management. With customizable retention policies and smooth integration into existing data pipelines, you can optimize storage and maintain efficiency. Flexible access through the UI, API, or CLI lets you retrieve exactly the data you need for streamlined exploration, analysis, and decision-making.
Data management.
RViz does not have any data management capabilities. Foxglove, on the other hand, provides a central data repository that allows you to upload, explore, set retention policies, and stream your robotics data.
The Timeline view in Foxglove displays each device’s data availability across time. It highlights whether data is ready to stream, actively being processed, or available for import from your robot’s disk using the Foxglove Agent. Use the Timeline to zoom in on specific devices and time ranges to see the status of your data. From there, you can fetch data that’s available for import, visualize it for in-depth analysis, or export it for use with other tools.
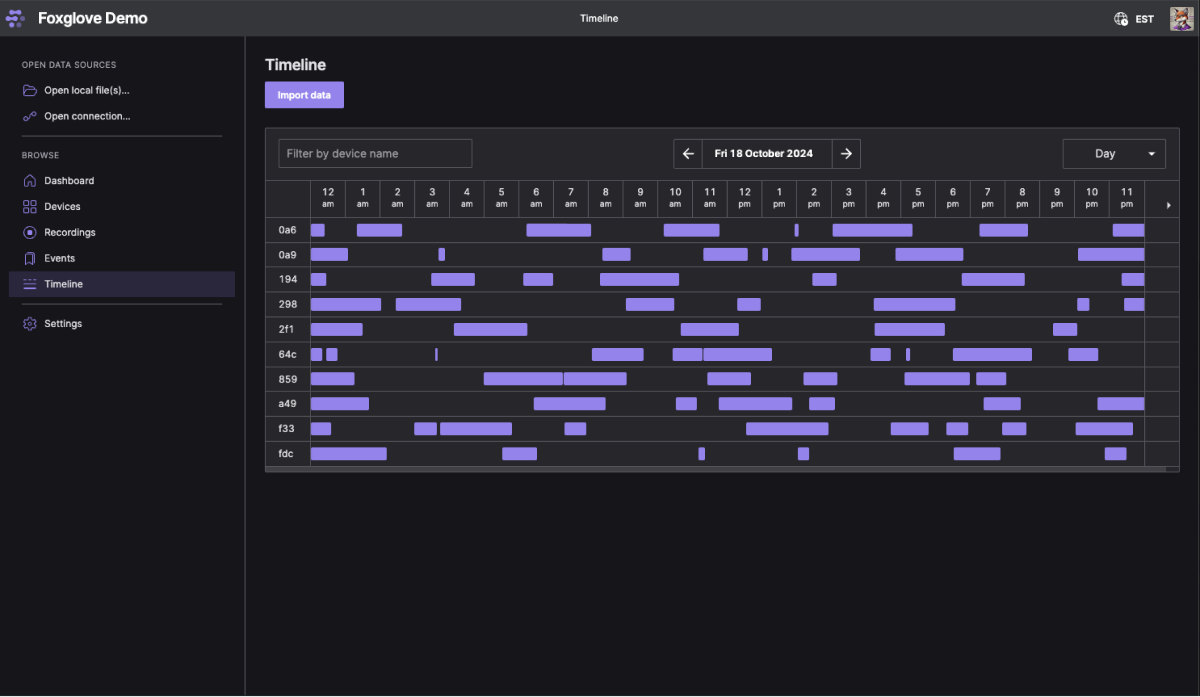
The Foxglove Timeline view.
Devices in Foxglove serve as representations of all the real and simulated robots your organization tracks. They act as a central reference point for managing and organizing data collected during operations.
When importing data, you can associate each recording with the device that generated it. This linkage ensures that all data is properly categorized and traceable, making it easier to analyze recordings, understand context, and troubleshoot specific robot behaviors. By organizing recordings under their respective devices, Foxglove streamlines data management and enhances collaboration across your team.
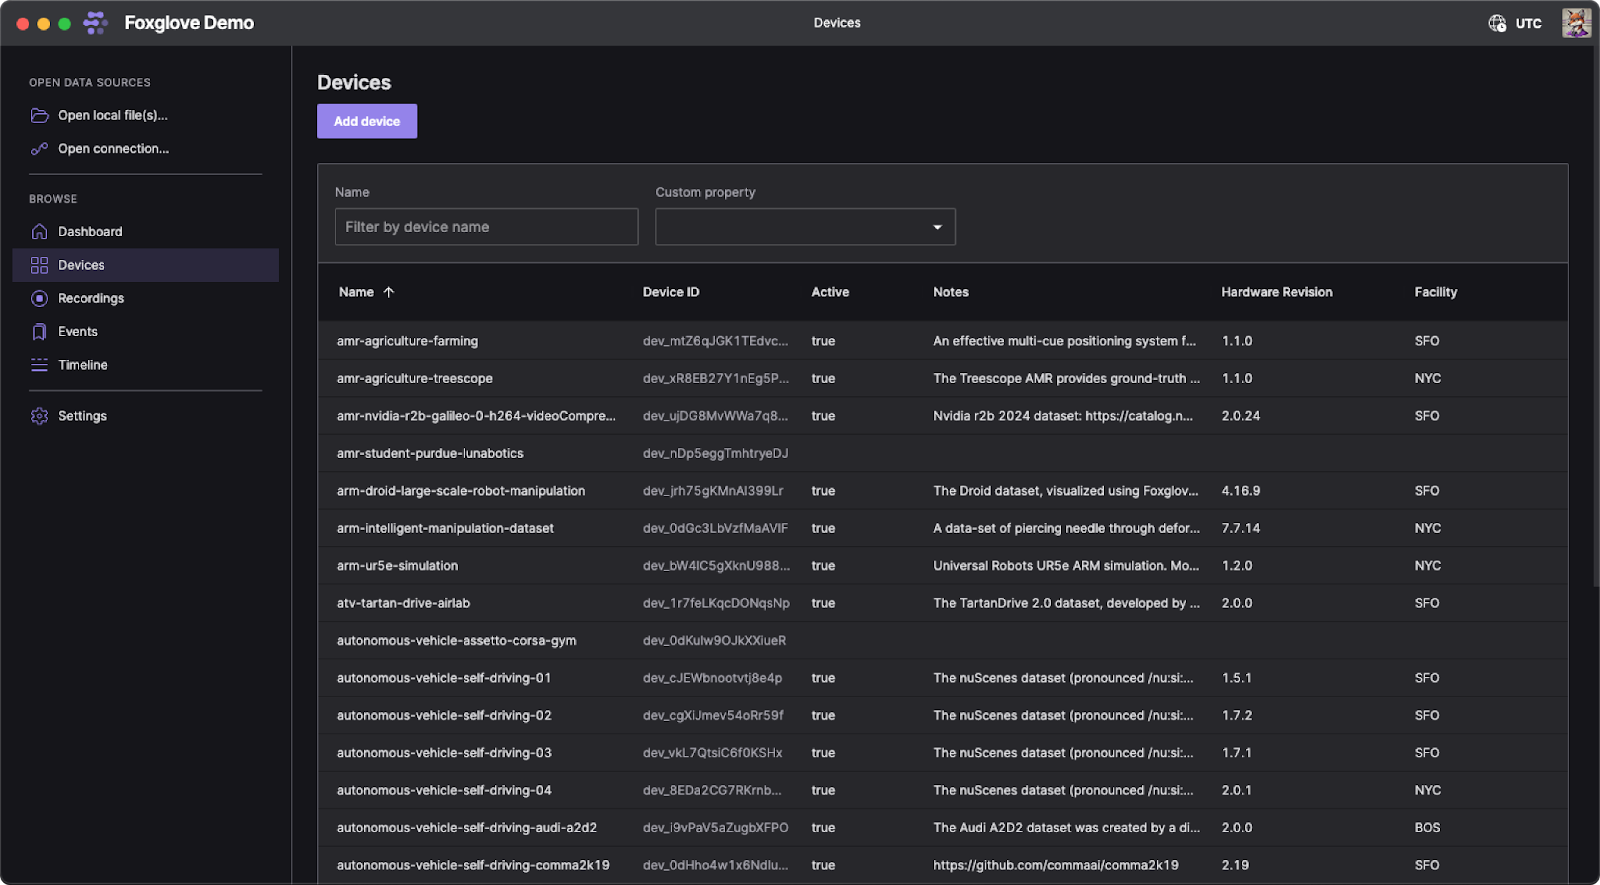
The Foxglove Devices view.
Events are key markers within your organization’s recordings, allowing you to quickly identify and categorize specific moments or periods of interest. These events streamline data exploration and help you focus on relevant subsets, improving efficiency during analysis.
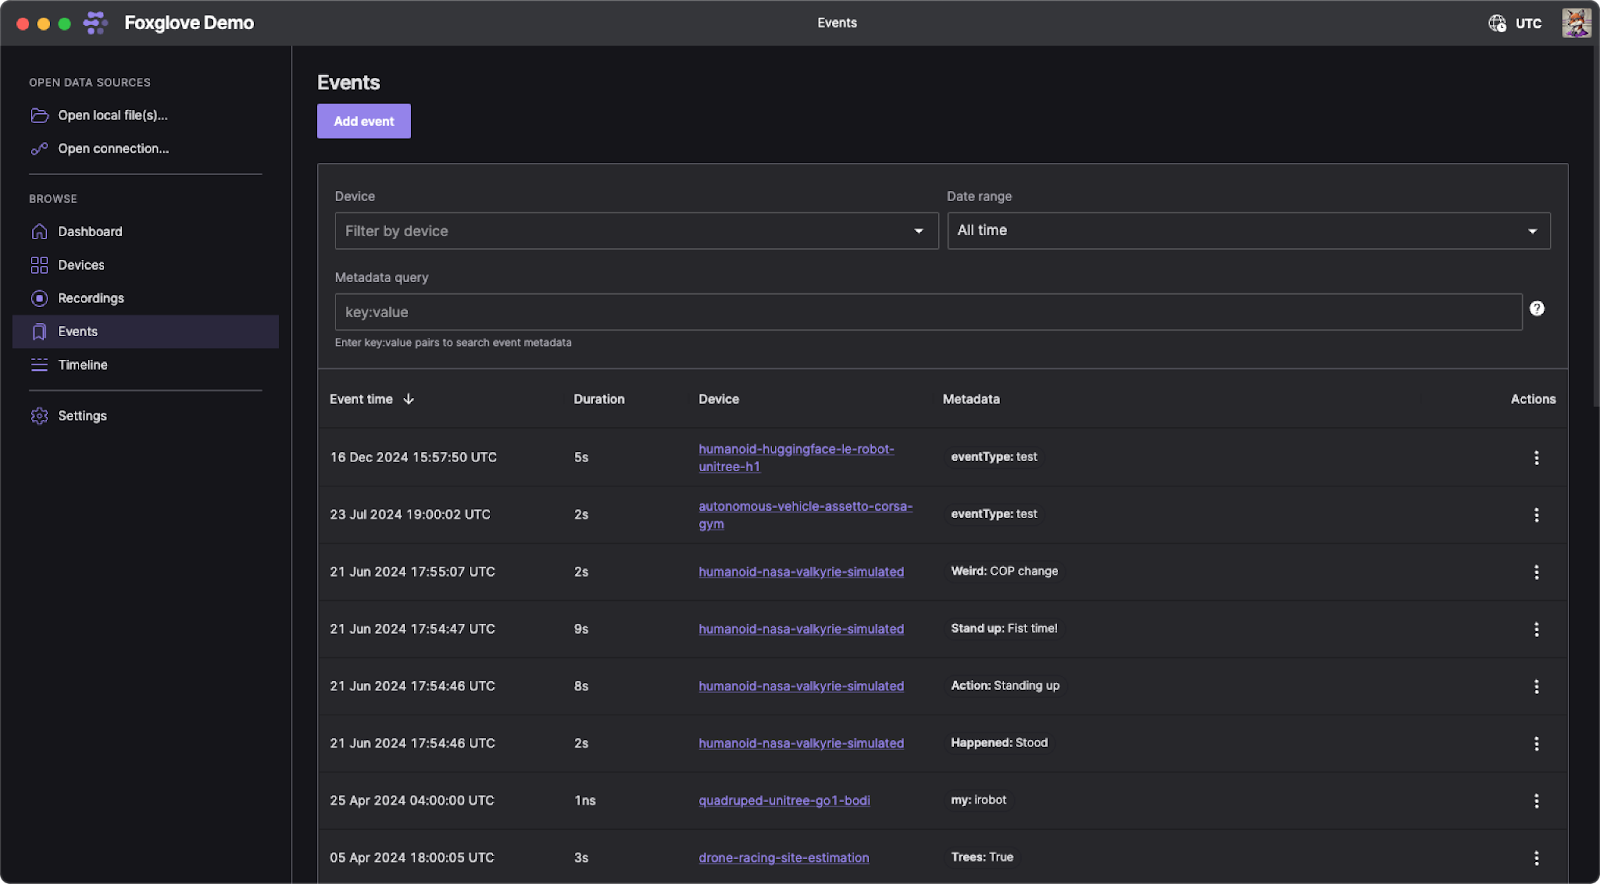
The Foxglove Events view.
Each event is tied to a specific device and requires essential information: a timestamp and a duration. For instantaneous events, the duration is set to zero. Events can also include optional metadata, providing additional context or details to enhance searchability and categorization. By leveraging events, you can simplify the process of locating and analyzing critical moments in your recordings, making your workflows more precise and efficient.
How to switch to Foxglove.
- Download and install Foxglove: choose Windows, macOS, or Linux or use it directly in your browser.
- Drag and drop your ROS bag files: start replaying and analyzing data immediately.
Foxglove is designed with a deep integration for ROS data, making it a powerful tool for visualizing and debugging ROS-based systems. Its compatibility with both ROS 1 and ROS 2, combined with its intuitive interface and seamless setup, ensures robotics developers can start visualizing and debugging ROS data quickly and efficiently. Whether you’re working on a small research project or scaling a complex robotics system, Foxglove’s comprehensive ROS support will enhance your insights and accelerate your development.
“We expected just easier visualization, but it turned out to be much more—unlocking invaluable efficiency for all our developers.” Robert Sun, Founding Engineer, Dexterity
Check out the Why Foxglove guide to learn more, sign up and get started for free, and join our discord community to share your projects and experiences and work with the best of them!