When you can't reach the robot: SOVD diagnostics and OTA updates in Foxglove via the ros2_medkit extension
Some time ago, I was watching a robot work from another building. My connection to it was weak, and for a few minutes my view dropped. When it came back, the robot had stopped moving, and I did not know why. Whatever went wrong had happened while I was not looking.
Foxglove is where I look at robot data, both live and recorded, and it is where I want to see when something breaks. What I needed that day were two more things in the same window: a record of the failure stored on the robot and a way to fix it without opening a shell. Those are the capabilities that ros2_medkit adds through its Foxglove extension. It brings the robot’s faults, its on-robot capture of a failure, and the repair actions into the panels next to my 3D view, creating a tight loop where I can see the problem and fix it in a single application.
ros2_medkit is our SOVD (Service-Oriented Vehicle Diagnostics, ISO 17978) gateway for ROS 2, which includes a Foxglove extension. This blog post follows one failure on a warehouse robot in simulation. The robot records the failure and I replay that record in Foxglove to find the cause, and I fix the robot over the air from a panel in the same window.
The setup
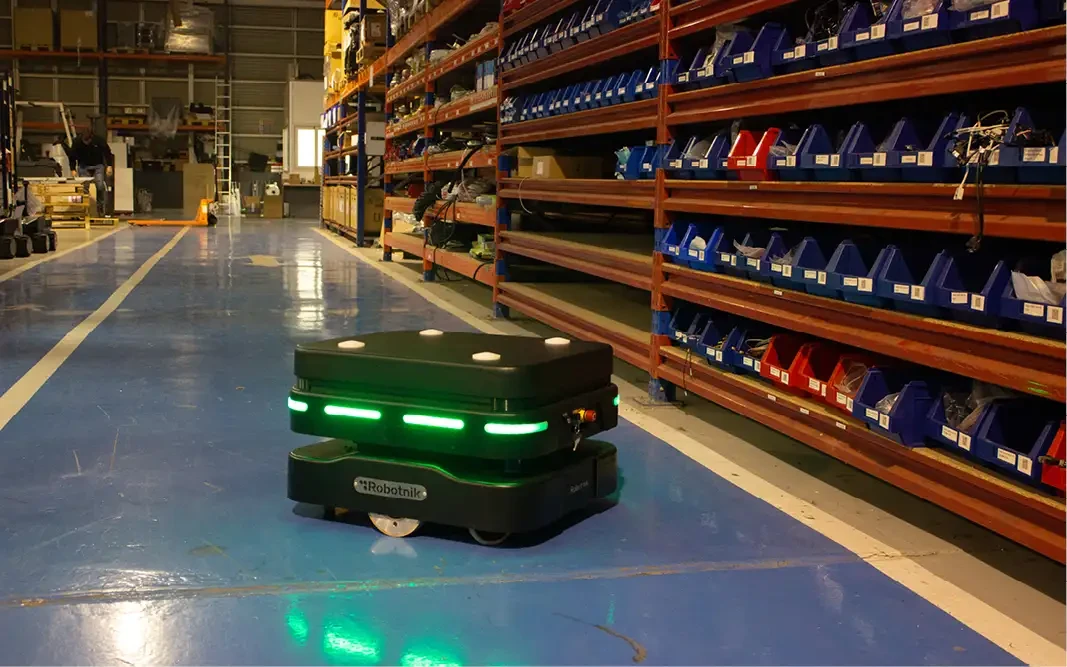
Robotnik RB-Theron AMR. Source: Robotnik Automation
The demo is a Robotnik RB-Theron, a differential-drive warehouse AMR, running Nav2 on headless Gazebo in the AWS small-warehouse world. foxglove_bridge publishes the usual topics: /tf, /scan, /odom, /map, the global and local costmaps, and /cmd_vel. Add a Foxglove 3D panel, and you see the robot in the warehouse: the laser scan, the costmap layers, and the path Nav2 is following down the aisle.
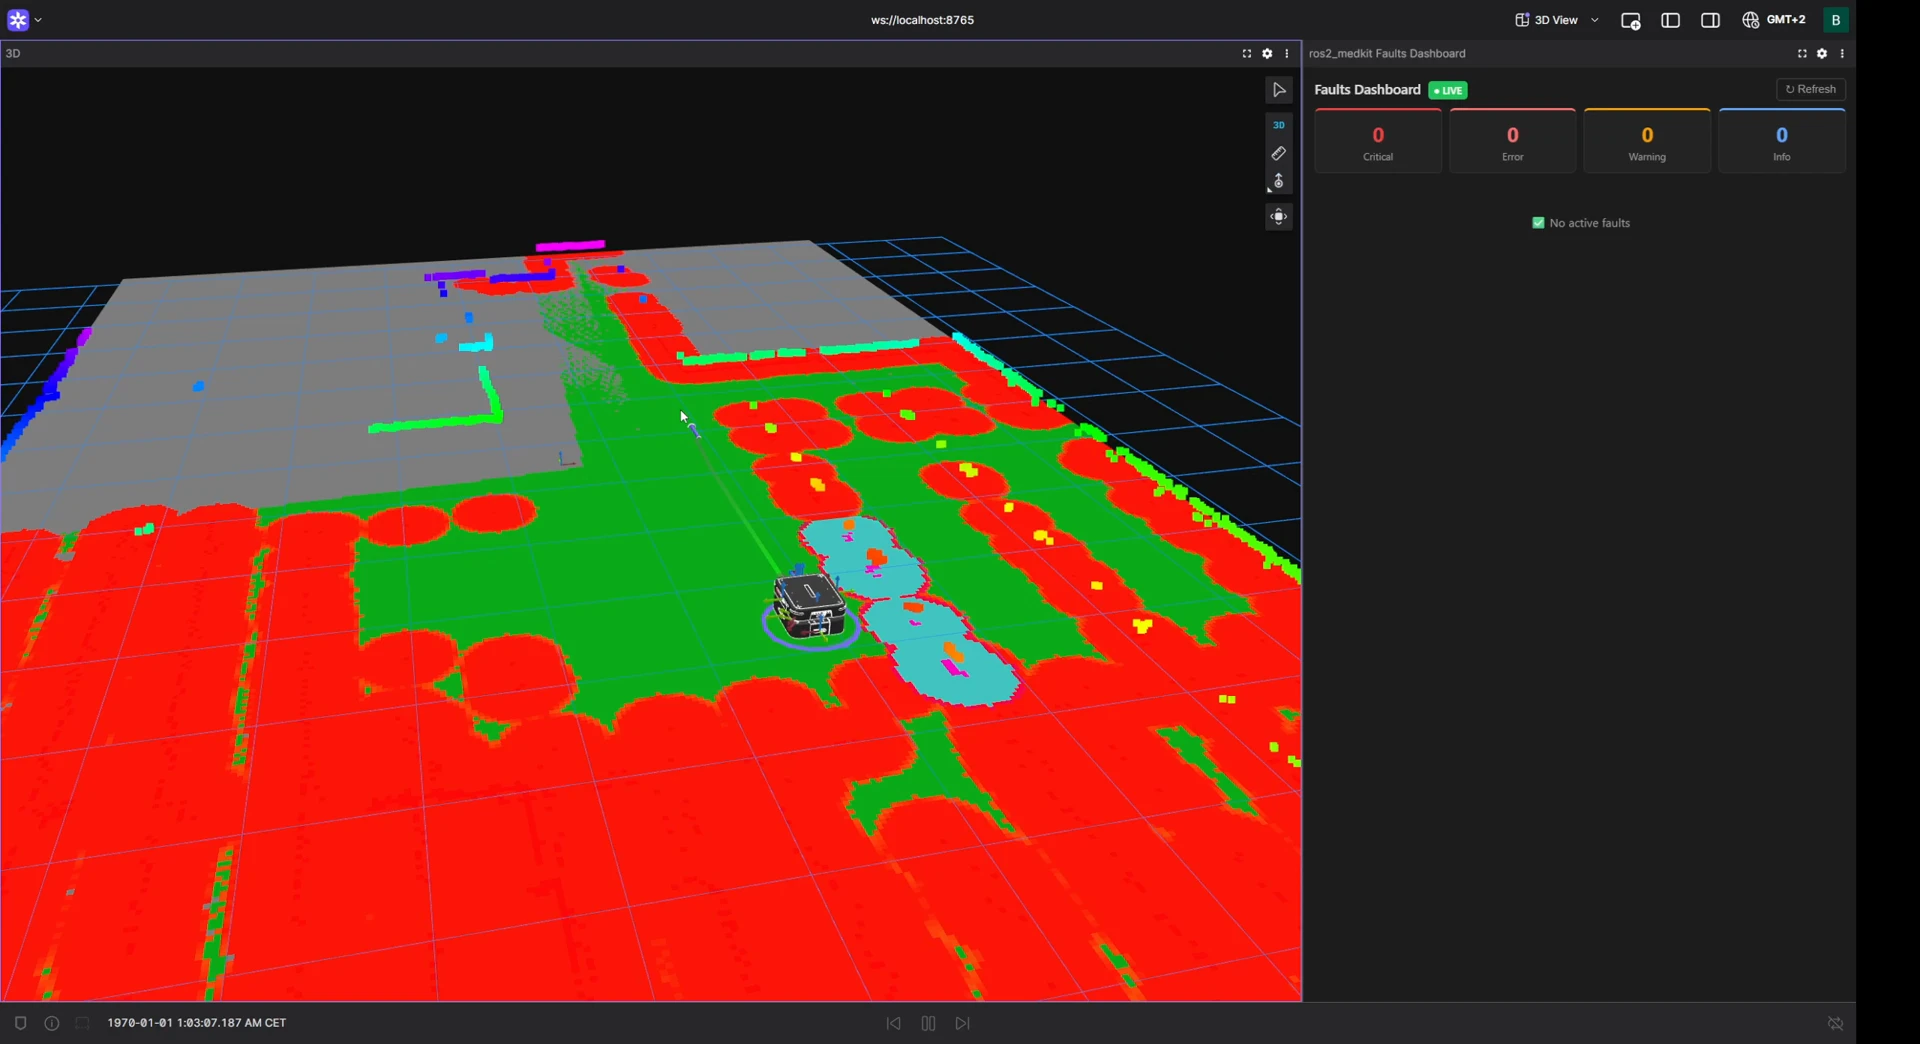
The RB-Theron in the warehouse - live scan, costmap, and a clear fault dashboard
ros2_medkit runs as an HTTP gateway on the robot, and the extension adds four Foxglove panels next to that 3D view:
- Entity Browser - a tree of the robot’s entities, with a tab per resource (data, operations, configuration, logs, faults).
- Faults Dashboard - the active faults, live.
- Updates - the software update catalog.
- Server Info - the gateway version and what it supports.
You set the gateway URL once and all four share it. Foxglove gives me the live and recorded view of the robot. On top of that, the extension adds structured fault information, on-robot failure capture, and the actions I run to fix it. All sharing that one gateway URL. Before the extension, acting on the robot required shell access; you had to SSH in, change a parameter or copy a new binary, and restart the node. The extension turns those actions into panels, behind the gateway’s role-based access control so only the right roles can run them.
What SOVD is, and why it helps here
SOVD is a REST-based, JSON-formatted diagnostic standard from the automotive industry. Cars have used standard diagnostic APIs to service large vehicle fleets for years, and SOVD is the modern, HTTP-based version of that idea. ros2_medkit brings it to ROS 2, so the same client works across different robots, and you build on a public standard instead of a custom protocol.
On the gateway, the robot’s areas, components, apps, and functions become queryable entities. Each entity exposes faults, logs, operations, and configuration. Software updates are handled at the server level, under /updates. The Foxglove extension reads all of this over the gateway’s REST API.
Send a goal, hit a failure
I send the robot a goal from the Foxglove 3D panel. The robot starts driving toward a far aisle, and on the way my view drops - the 3D panel shows “Connection failed.”
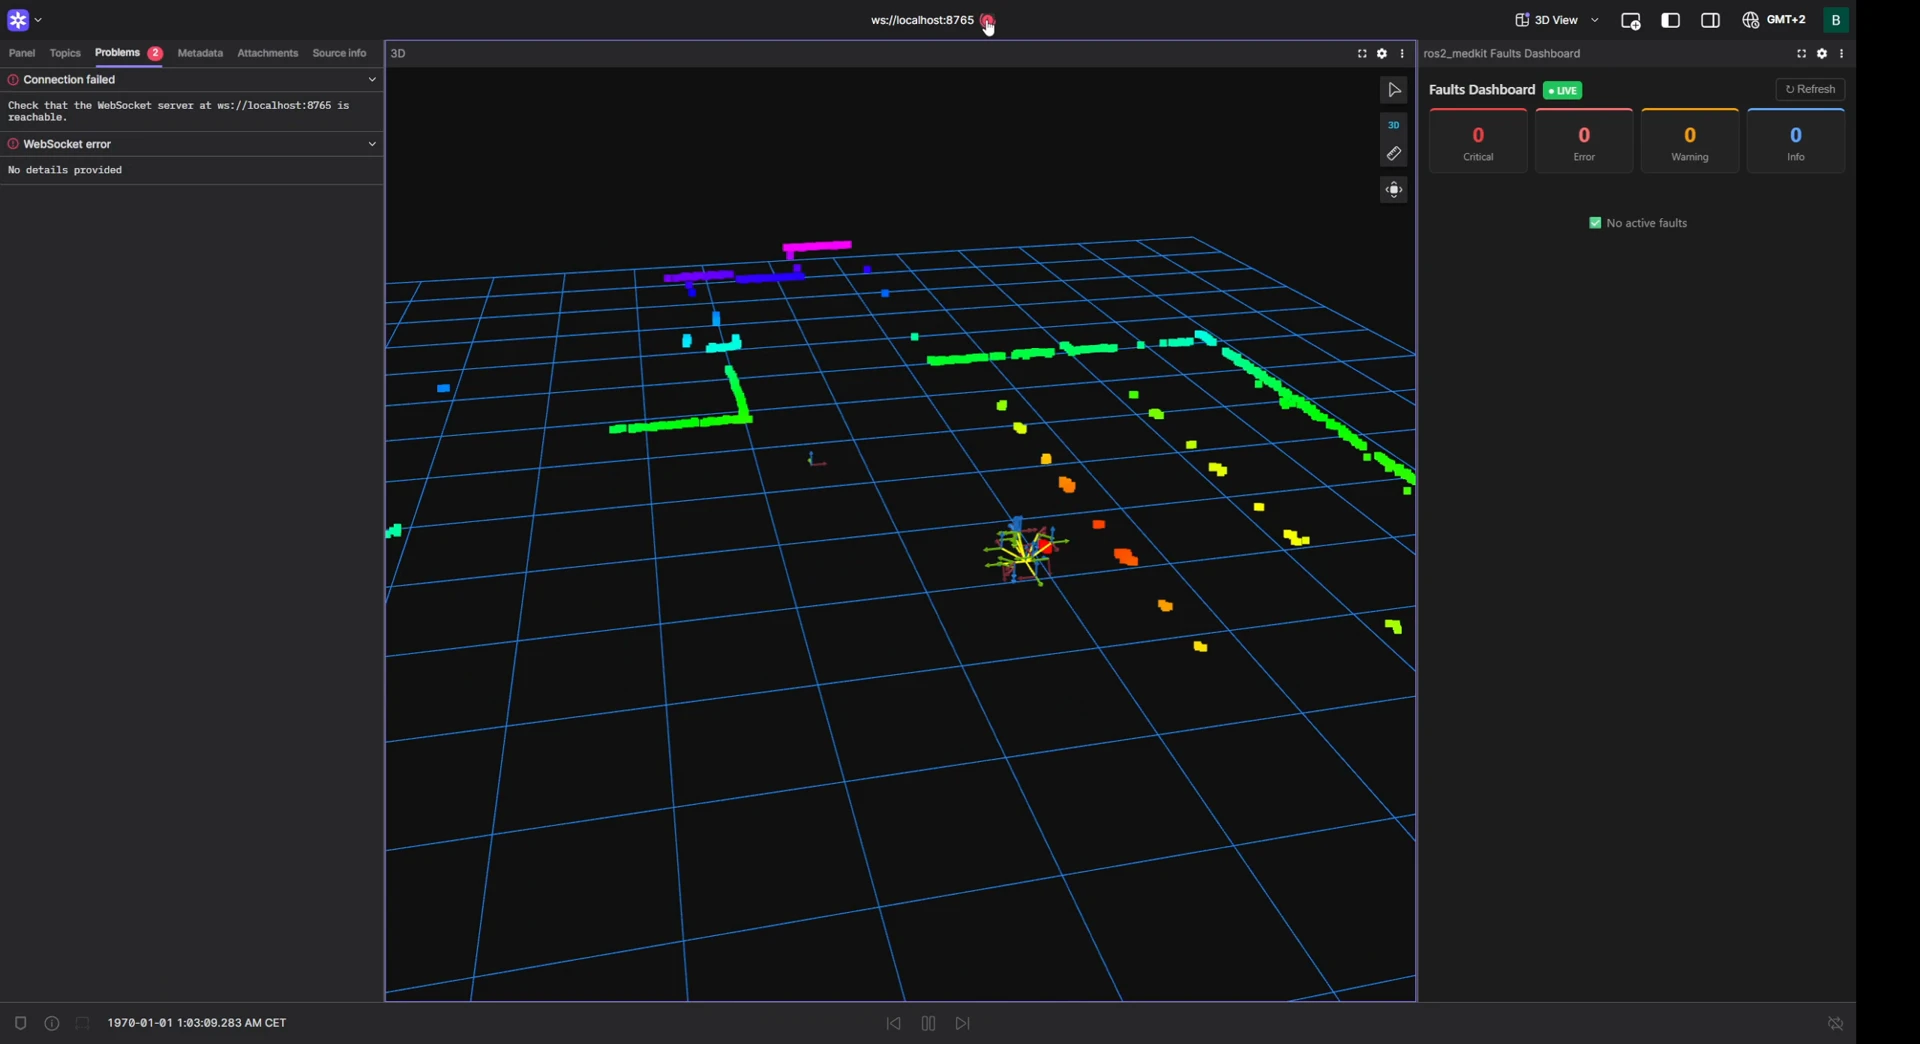
The operator’s live view drops. The dashboard on the right keeps updating only because this recording cuts the Foxglove bridge, not the network.
What I did not know at the time: earlier that morning, an over-the-air update had gone out to the sensor stack, tagged as a routine /scan noise-filter change. It had a bug. A forward slice of the laser now reports a phantom close return, a wall that is not there, right in front of the robot. It is a stuck LiDAR sector, the kind of fault a firmware regression or a smudged window can cause, and because it is attached to the sensor, it sits in front of the robot no matter which way it turns.
Nav2 does the safe thing; it considers a phantom return an obstacle and won’t plan a trajectory through it. Since it can’t find a way around it, it gives up after executing recovery behaviors. The goal aborts, and the robot stops. But I was offline, so I didn’t see any of it live.
The key point is that the Faults Dashboard itself would not remain available during a real outage. It is a Foxglove panel and, like the rest of the interface, depends on a network connection to the robot. If that connection drops, the operator loses the entire view.
The robot, however, keeps running. The ros2_medkit gateway, fault manager, and capture system all run on the robot itself. They detect the failure, raise the fault, freeze the relevant frame, and save a short MCAP recording even when no operator is connected.
Because the record is created and stored on the device, it remains available when the connection returns. The guarantee is not that the dashboard survives the outage. It is that the robot preserves a complete record of what happened while the operator was offline.
The robot turns its own failure into a fault
It is important to be precise about what the robot actually reports. The LiDAR node does not detect or announce its own bug. It is simply publishing sensor data, so the gateway only sees the downstream consequence: Nav2 is no longer able to navigate successfully.
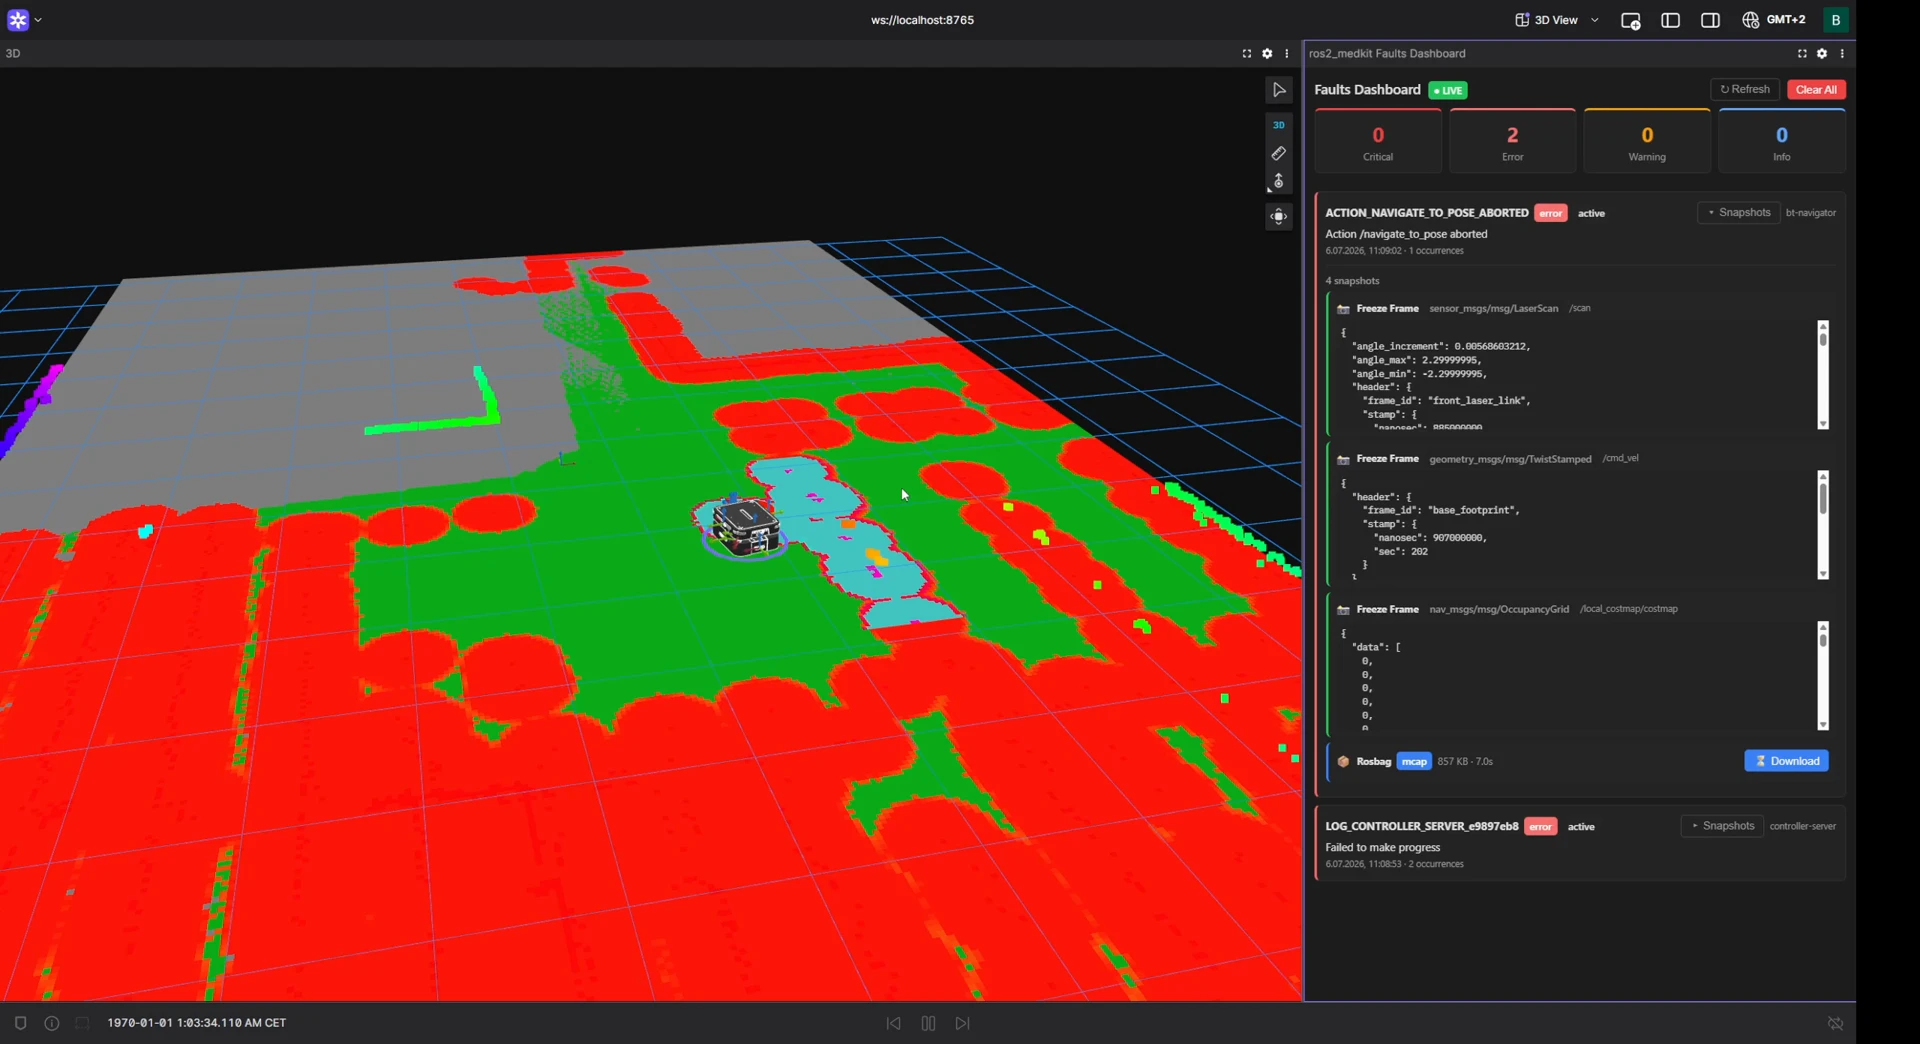
The fault, its freeze-frame, and a downloadable MCAP.
Two small, sensor-agnostic watchers turn that failure into faults.
One of them monitors /rosout. When controller_server logs that it failed to make progress, the watcher creates a fault on the controller-server entity.
The other monitors action results. When navigate_to_pose aborts, it creates an ACTION_NAVIGATE_TO_POSE_ABORTED fault on the bt-navigator entity with error severity.
In other words, the robot tells me that navigation failed. It does not tell me that the LiDAR data is wrong. Identifying the LiDAR as the root cause is still my job, and the captured recording is what gives me the evidence to do it.
The fault triggers a capture. The robot does not record all telemetry continuously, because storing full data from every robot would quickly exceed the device’s available storage. Instead, once the fault is confirmed, the gateway saves only the data needed to investigate it.
That capture includes a freeze-frame of relevant topic values at the moment of failure, such as /scan, /cmd_vel, and the local costmap, along with a short rosbag: a seven-second MCAP covering the moments around the fault. The recording is attached directly to the fault and available for download, so the evidence is already grouped and labeled with the failure it belongs to.
The fault also latches. It does not disappear simply because the robot stops struggling. It remains active until someone clears it manually. That means a fault raised while I was offline is still waiting for me when I reconnect.
Replay it in Foxglove
I open the Faults Dashboard, one of the panels in my Foxglove layout. The ACTION_NAVIGATE_TO_POSE_ABORTED fault is listed on the bt-navigator entity, along with the time it was raised and a button to download the associated capture.
The capture is a rosbag stored in the open MCAP format and served by the gateway through the SOVD bulk-data endpoint. Because each fault is linked to its own recording, I can download it directly from the dashboard or retrieve it manually:
# the fault's bulk_data_uri points to its capture
curl -OJ http://localhost:8080/api/v1/apps/bt-navigator/bulk-data/rosbags/ACTION_NAVIGATE_TO_POSE_ABORTED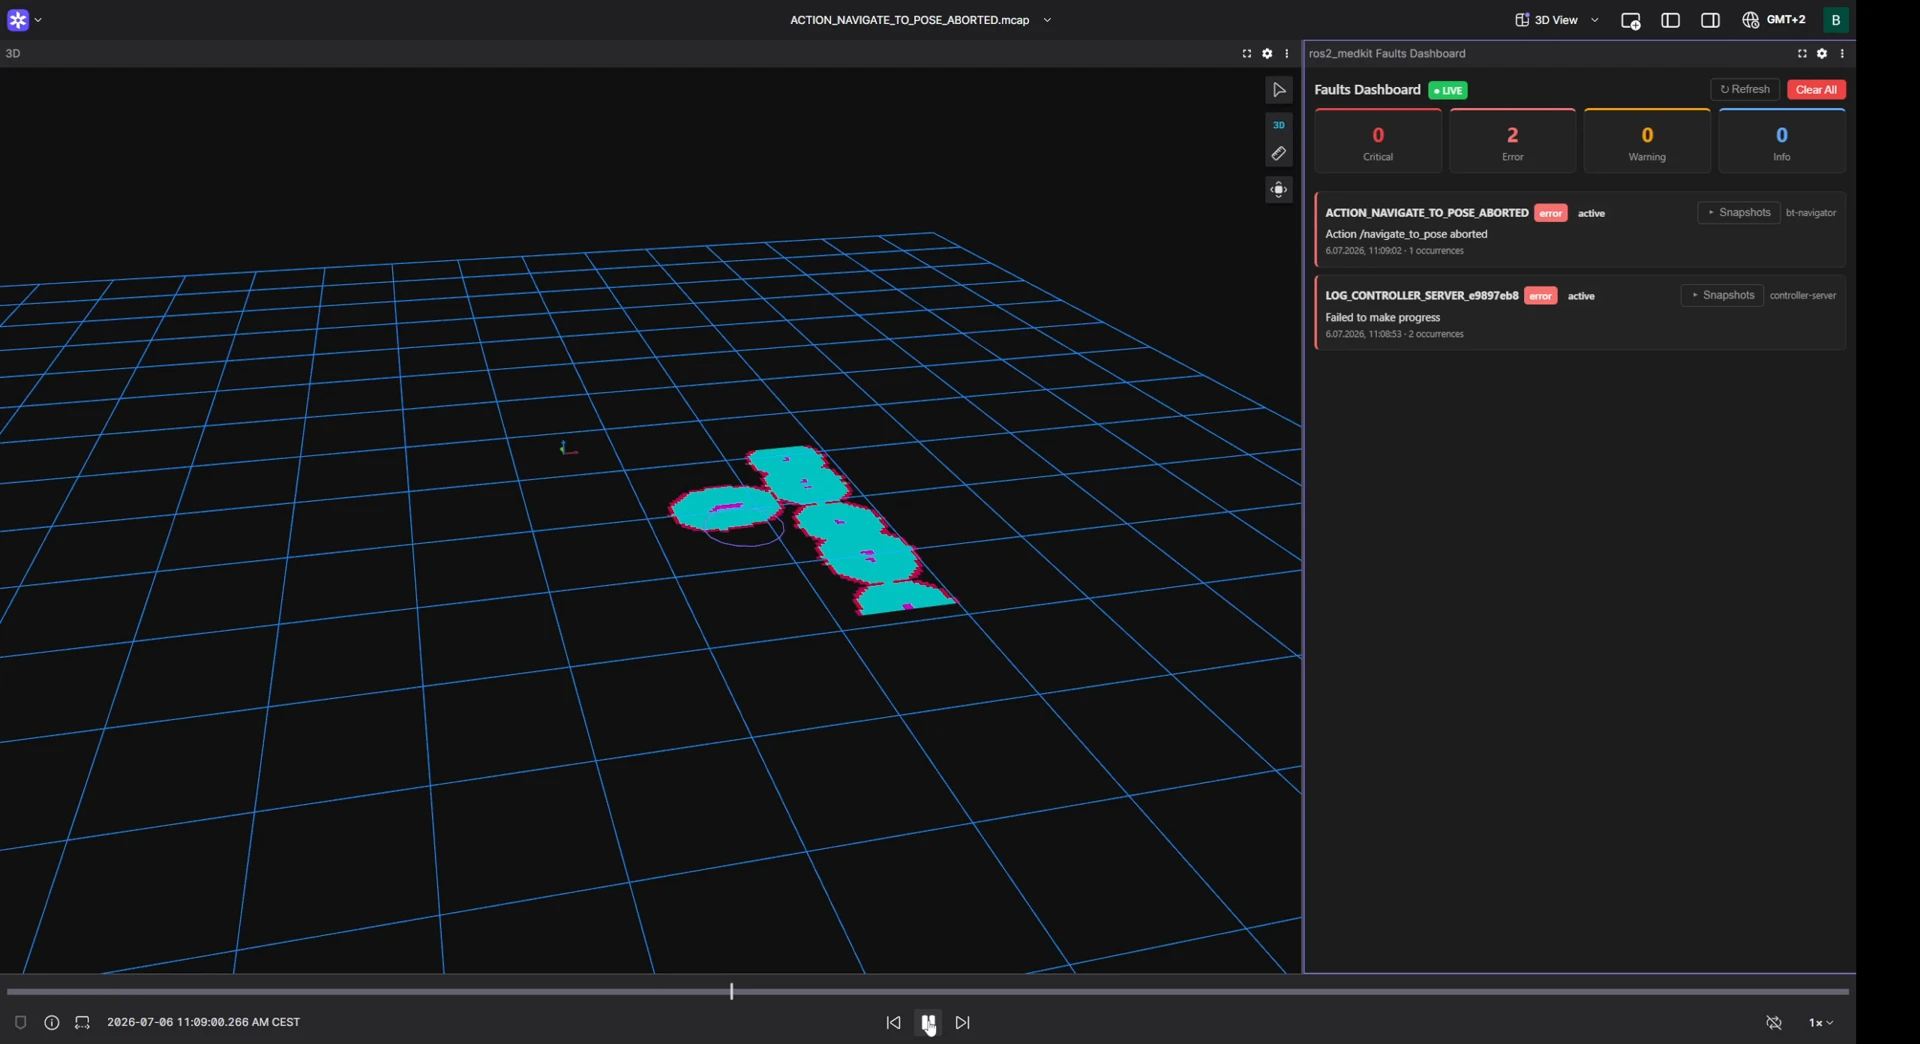
The downloaded MCAP replaying in Foxglove - the phantom LiDAR sector isolated
I open the file in Foxglove and replay it in the same 3D panel I use every day. This time, I can see what the live view never showed me: a solid arc of returns directly ahead that does not match the rest of the scan, the costmap interpreting it as a wall, and Nav2 unable to find a path through.
The navigation fault indicated that the robot had stalled. The capture shows me why: the LiDAR was reporting an obstacle that was not actually there.
The few minutes I missed are no longer a gap. They are a recording I can step through using the real data from the failure.
Find what changed, then fix it
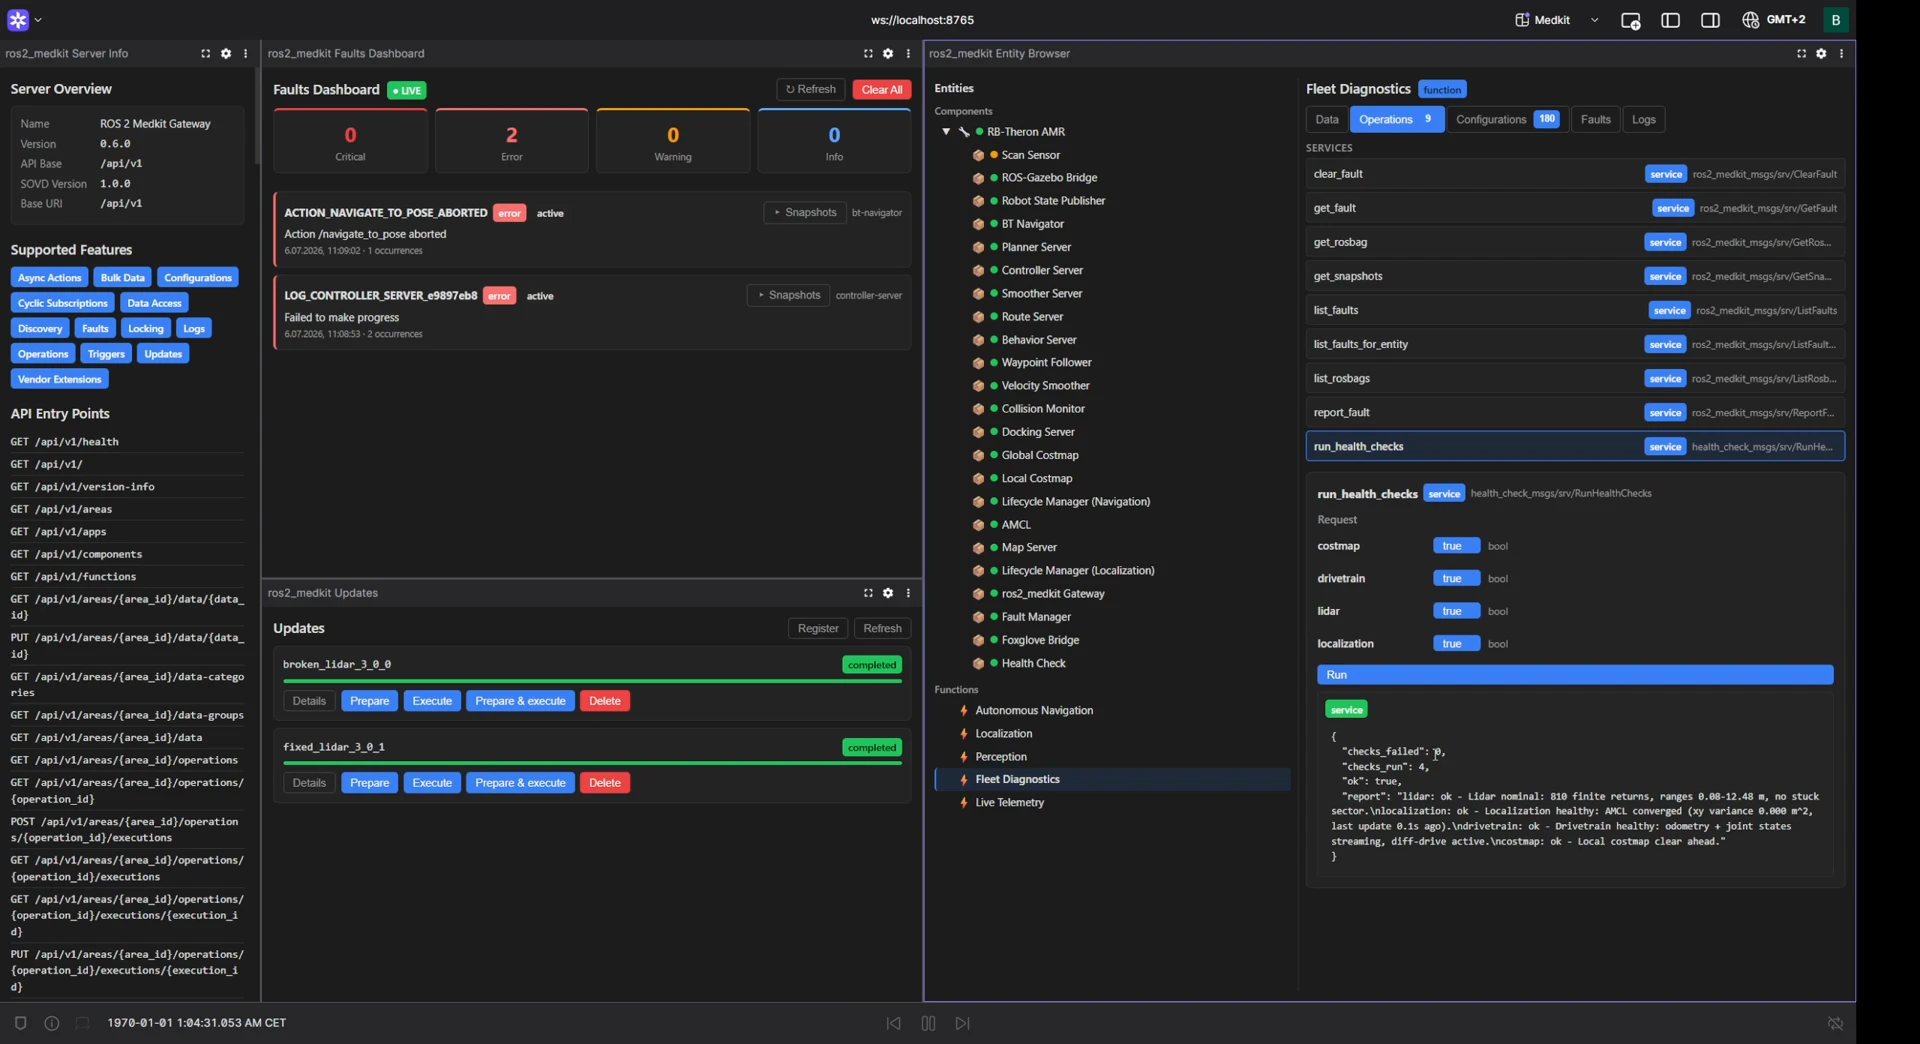
I know LiDAR is lying. The next question is why, and the answer is usually “something changed.” The whole robot in ros2_medkit is represented as a SOVD entity tree - every Nav2 node, the gateway, a health-check app - grouped into functions, and the Updates panel lists the update catalog and shows which build is applied.
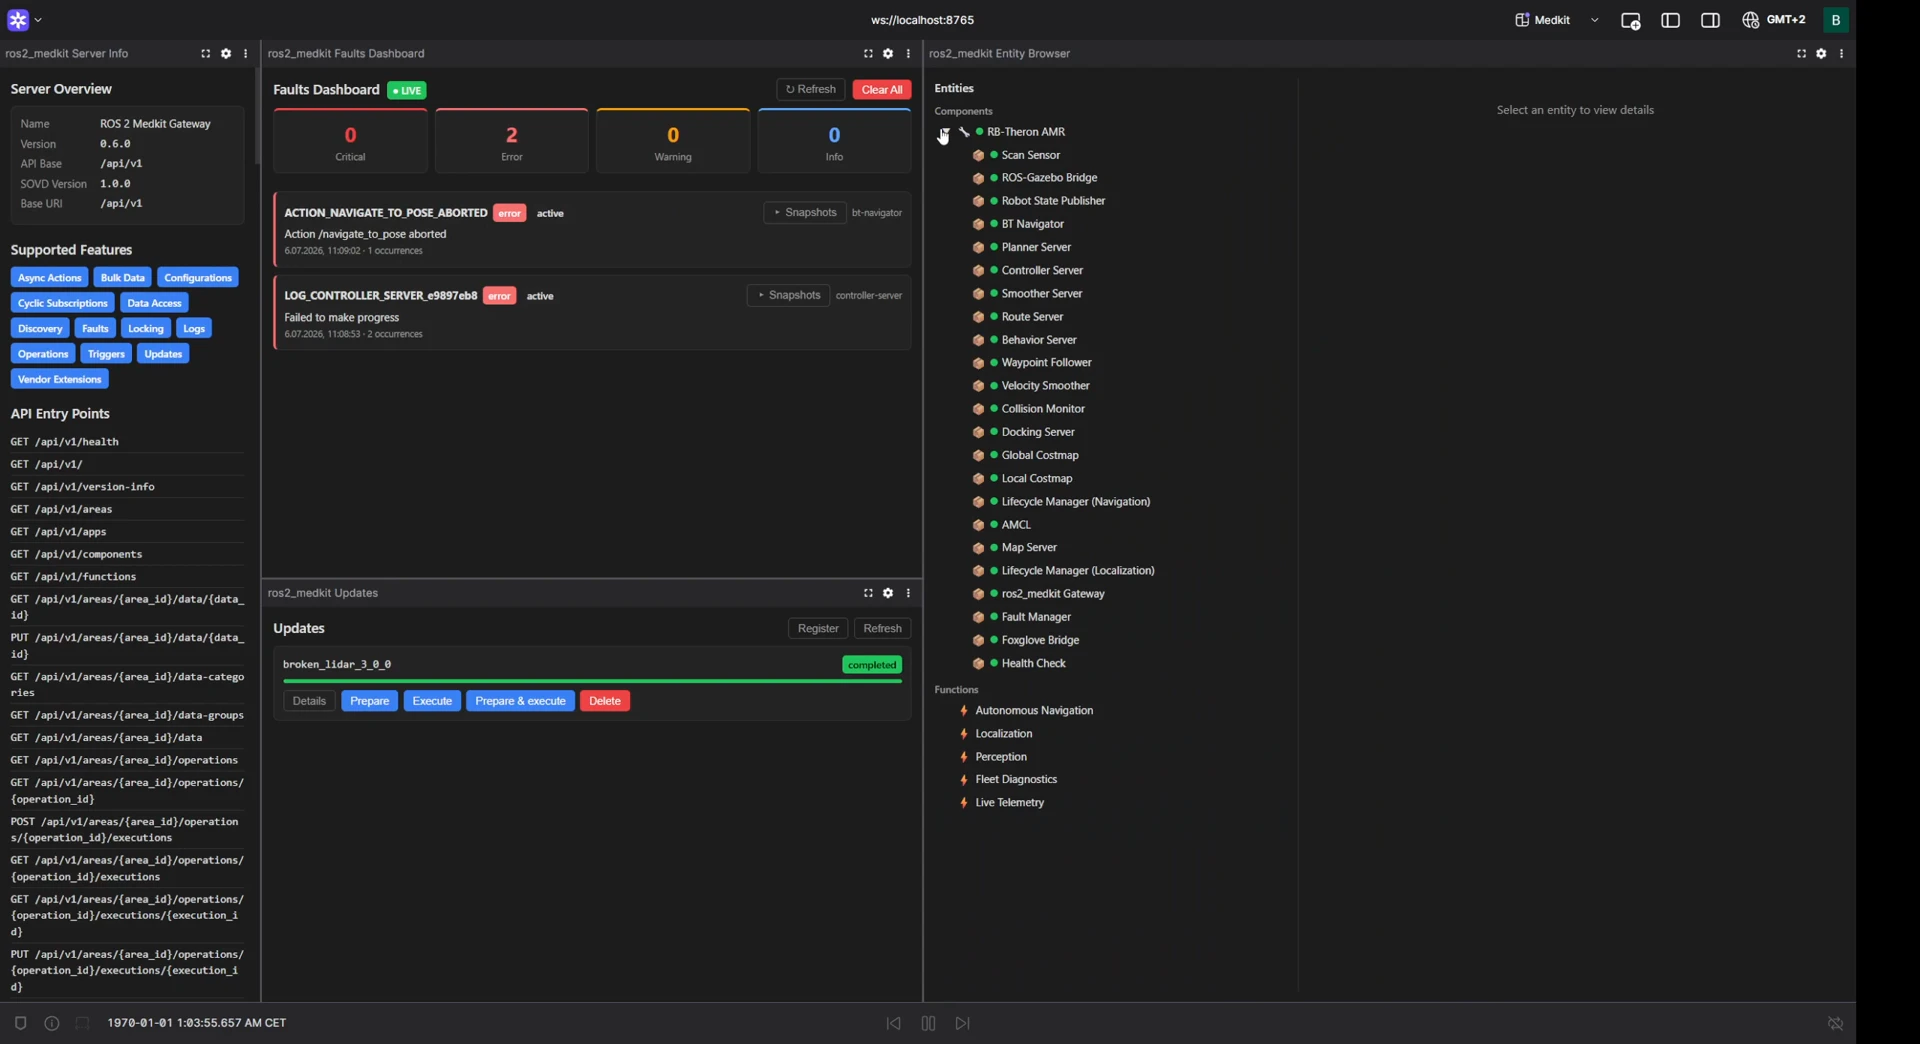
The SOVD entity tree, functions, and the update catalog
There it is, and it is the only entry: the sensor build broken_lidar_3_0_0 was swapped this morning, right before the trouble started. That timing is the thread to pull.
Before changing anything, I confirm the root cause. Under the Fleet Diagnostics function, the robot exposes a single run_health_checks operation. I select the subsystems I want to test - LiDAR, localization, drivetrain, and costmap - and run the check.
Foxglove builds the request form directly from the service schema, so I can trigger the diagnostics with a click instead of constructing a ros2 service call by hand.
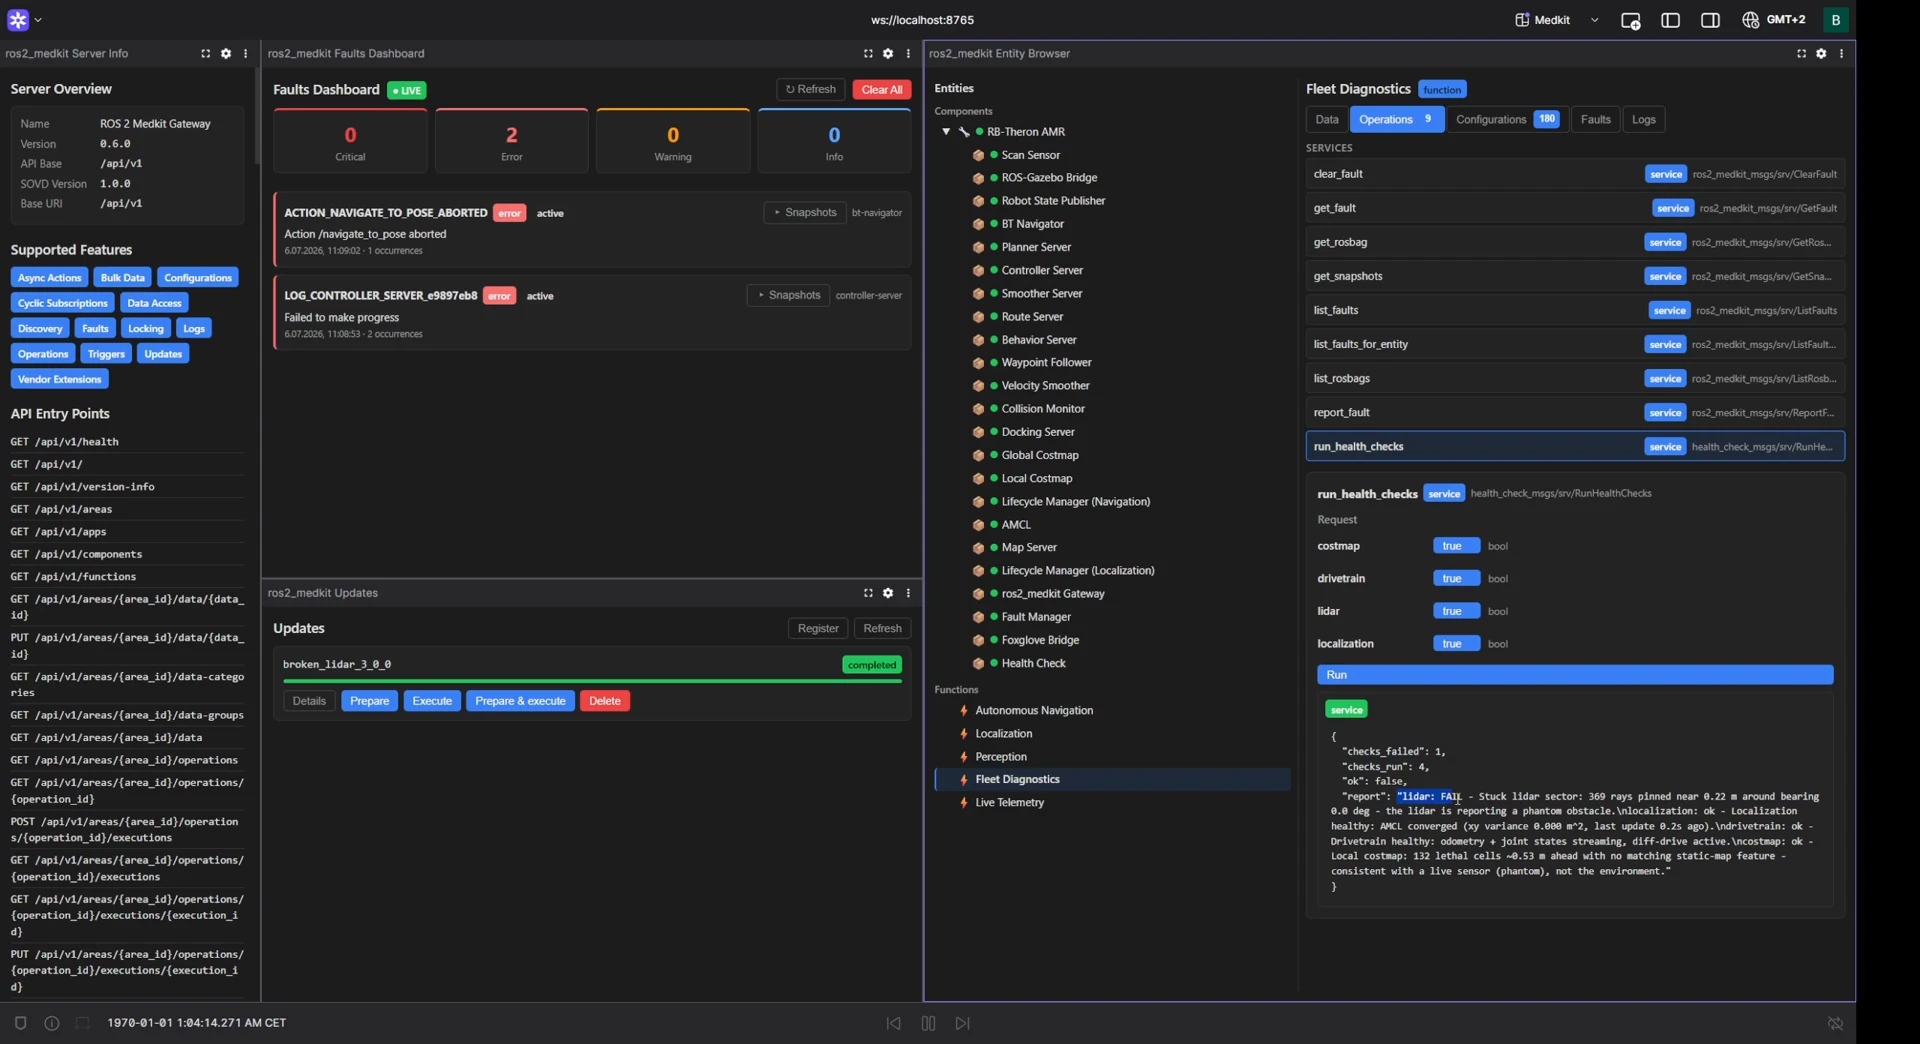
run_health_checks: the LiDAR fails, everything else is healthy
It comes back as one report. Localization is healthy - AMCL converged. The drivetrain is healthy. The costmap flags a lethal blob just ahead with no matching feature in the static map, “consistent with a live sensor, not the environment.” And the LiDAR is red: a stuck sector, hundreds of rays pinned at a constant close range. That is the confirmation I wanted: it is the LiDAR, not something downstream of it, and the phantom is coming from the sensor, not the world.
So I ship a hotfix. The corrected build, fixed_lidar_3_0_1, is not sitting in the catalog waiting - a bad update does not arrive with its own fix pre-loaded. I publish it first (via a SOVD register call), then apply it in the Updates panel.
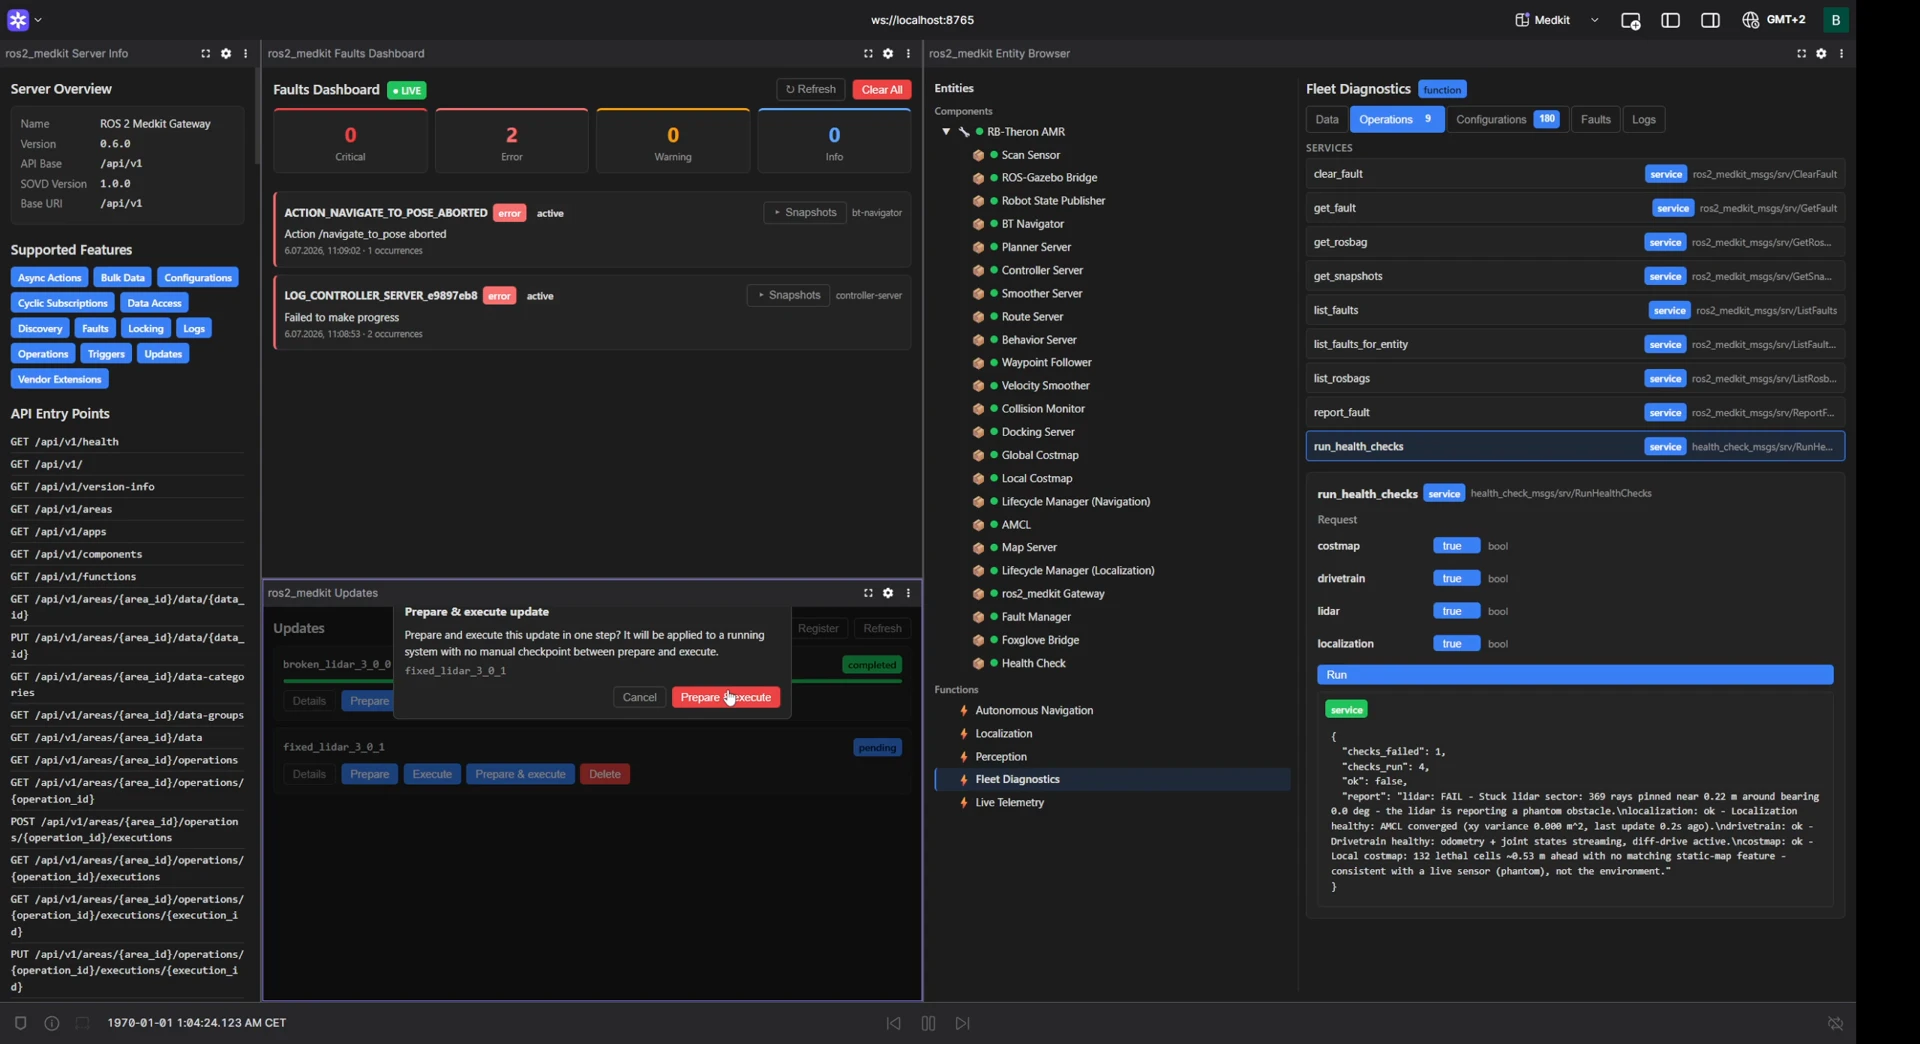
Applying the OTA update: the Prepare & execute confirmation for fixed_lidar_3_0_1
Prepare & execute downloads the artifact and replaces the running sensor binary in a single operation, directly on the live robot. There is no SSH session and no restart. The dialog makes the behavior explicit: the update is “applied to a running system with no manual checkpoint between prepare and execute.” The equivalent manual process requires registering the artifact first, then applying it in two separate steps:
./publish-fix.sh    # registers fixed_lidar_3_0_1 via POST /api/v1/updates
curl -X PUT http://localhost:8080/api/v1/updates/fixed_lidar_3_0_1/prepare
curl -X PUT http://localhost:8080/api/v1/updates/fixed_lidar_3_0_1/execute
The gateway swaps the bad sensor build for the good one, and the phantom arc is gone from /scan. I re-run the health checks to be sure.
After the fix: both builds in the catalog, health checks all green
run_health_checks now comes back ok: true, nothing failed: the LiDAR reads nominal again, a full sweep with no stuck sector, and the costmap is clear. The Updates panel shows both the broken_lidar_3_0_0 that was installed in the morning with a bug in it and the newly applied fixed_lidar_3_0_1 - the fix that replaced the old version.
The fault does not clear on its own, and I would not want it to: it is a record that something failed, and clearing it is my call. I clear it from the panel and resend the goal.
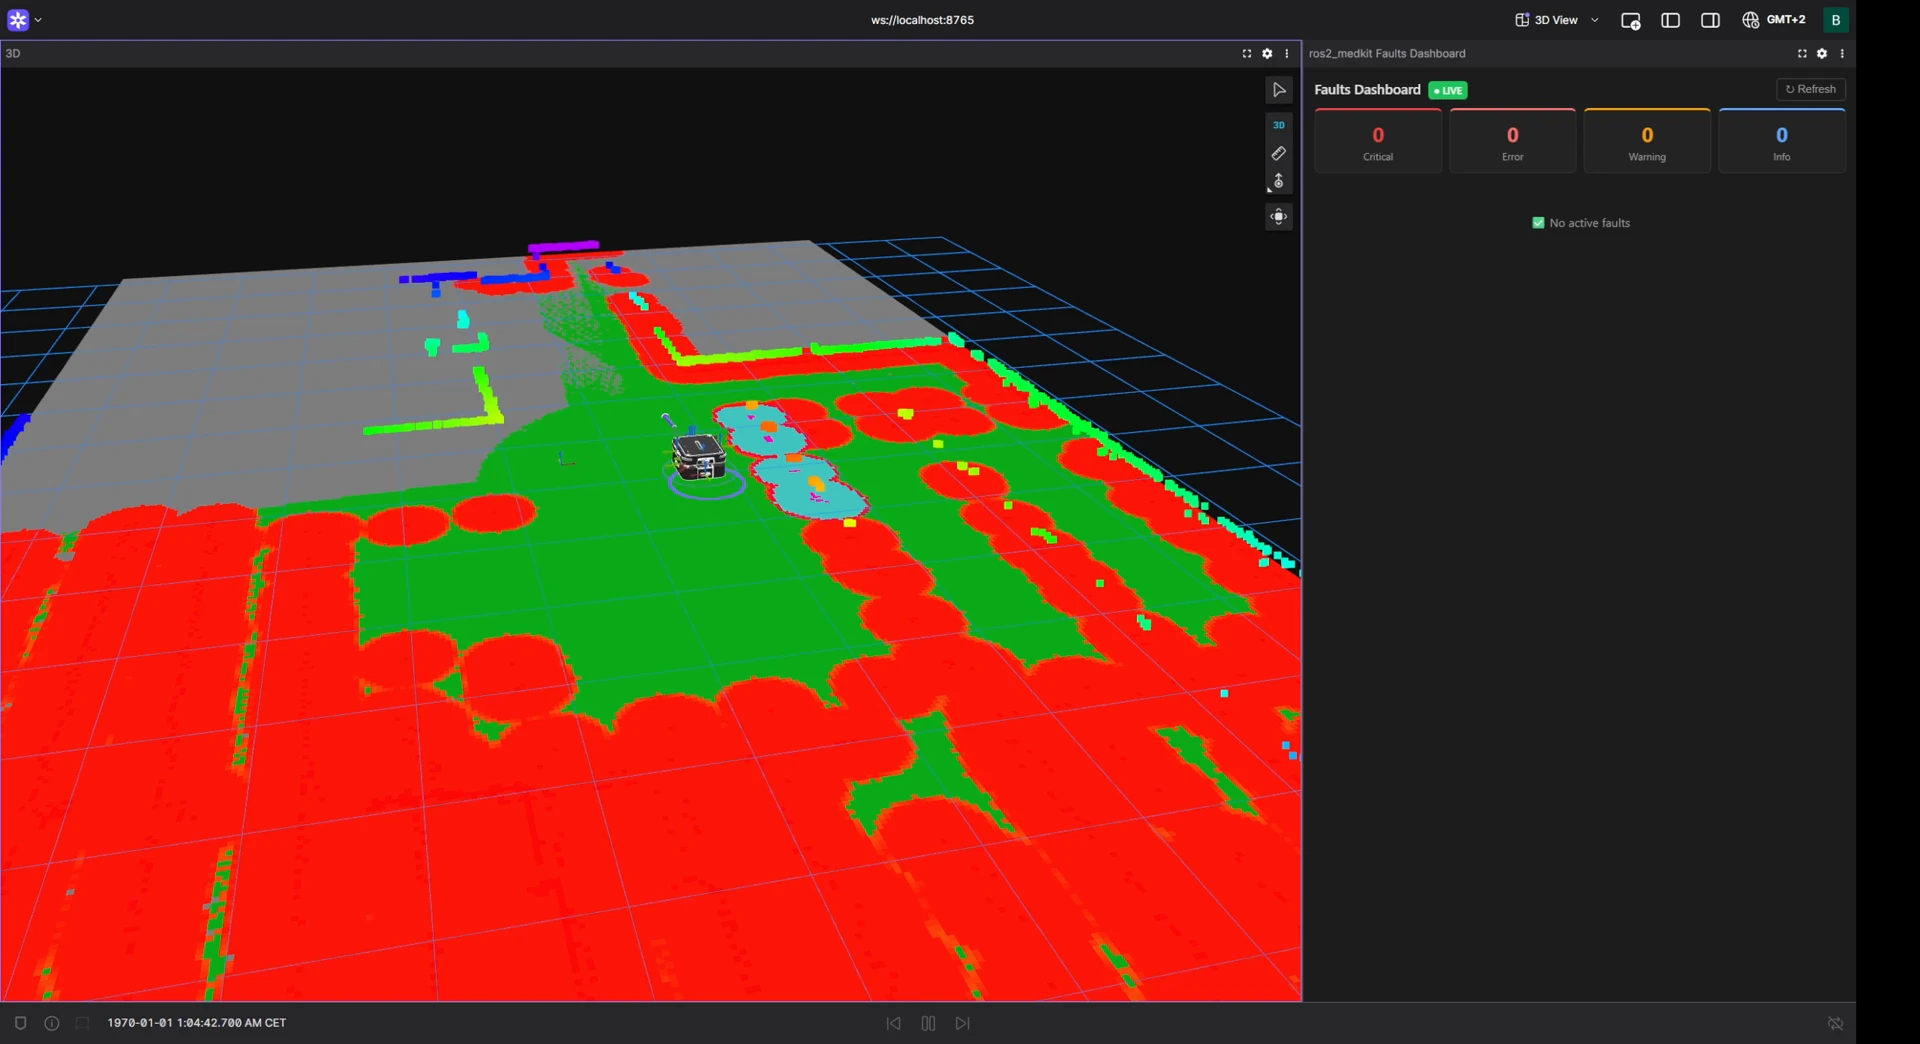
The mission resumes: faults cleared, the robot drives on
This time the scan is clean, Nav2 drives the robot down the aisle, and it reaches the goal. By design, a person approves every action - nothing changes on the robot on its own. And it all runs on the local network, with no link to the cloud so that you can do it on a robot behind a firewall or with no internet connection.
How the panels work with the gateway
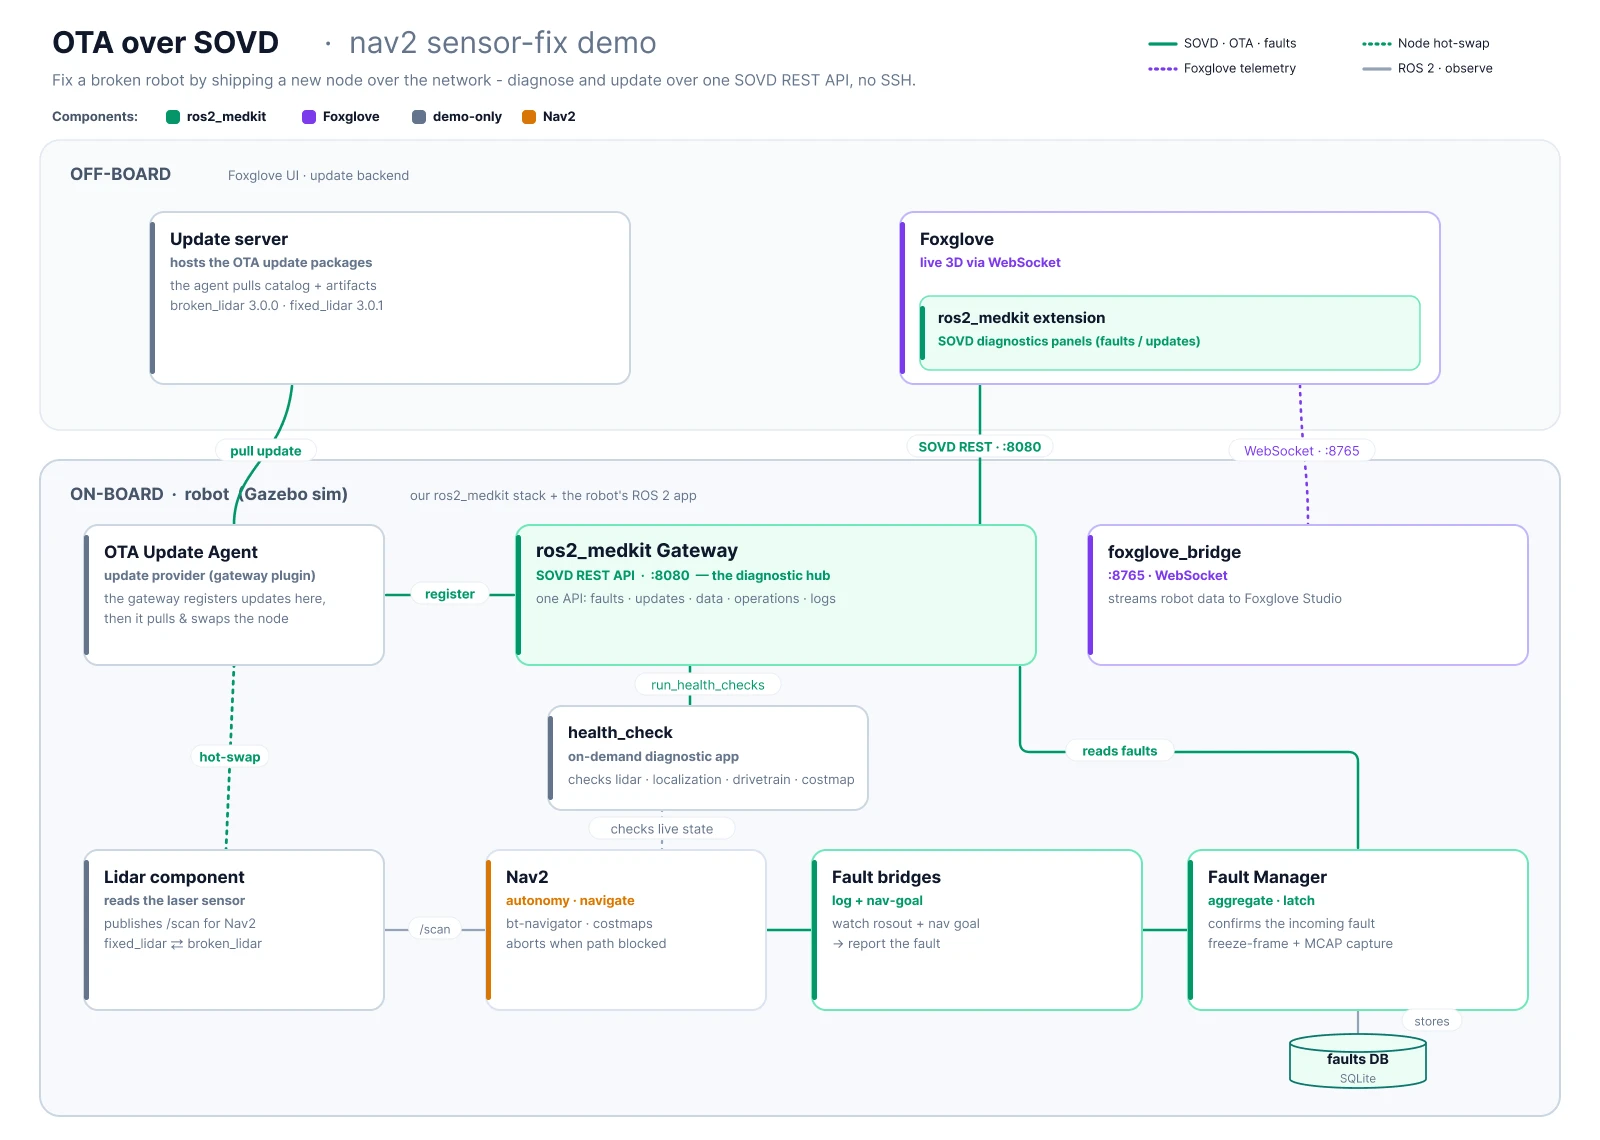
OTA over SOVD - the architecture
The panels are built with the Foxglove extension API. Each one registers as a panel and uses the settings interface to configure the gateway URL.
They are also capability-driven. When a panel connects, it reads the gateway’s root endpoint to determine which features are available, then shows only the relevant tabs. A gateway without a log manager, for example, simply displays fewer options.
Behind the panels, every HTTP request goes through a typed client generated from the gateway’s OpenAPI document. The fault stream uses the same client’s Server-Sent Events helper. This keeps the panels aligned with the gateway’s request and response schemas, without requiring us to maintain route strings or payload definitions by hand.
The Faults Dashboard receives new faults over Server-Sent Events, so they appear as soon as they are raised. It also polls at a configurable interval as a fallback.
Because the gateway API is published as an OpenAPI document, these panels are only one way to use it. You can generate a client in your preferred language and automate against the gateway directly.
Run it yourself
The complete goal–failure–fix loop is available in the ota_nav2_sensor_fix demo in selfpatch_demos.
A single script builds the update artifacts and starts the gateway, OTA plugin, demo nodes, and update server:
./run-demo.sh
The demo runs an RB-Theron with Nav2 in a headless Gazebo simulation of the AWS warehouse. It also starts foxglove_bridge on port 8765.
In Foxglove:
- Connect to
ws://localhost:8765. - Add a 3D panel.
- Add the
ros2_medkitpanels. - Set their gateway URL to
http://localhost:8080/api/v1.
At startup, the demo automatically applies the faulty sensor update, so the robot begins in the regressed state you would encounter in a real deployment.
Send the robot a goal using the 3D panel’s Publish tool, or run:
ros2 topic pub --once /goal_pose geometry_msgs/msg/PoseStamped \
  '{header: {frame_id: map}, pose: {position: {x: 1.8, y: 2.3, z: 0.0}, orientation: {w: 1.0}}}'
Nav2 stalls, the ACTION_NAVIGATE_TO_POSE_ABORTED fault appears on the bt-navigator entity in the Faults Dashboard, and the robot stops.
From there, the full recovery flow is:
- Download the fault capture.
- Replay it to inspect the phantom LiDAR sector.
- Run the health checks.
- Publish and apply
fixed_lidar_3_0_1from the Updates panel, or use the API calls shown above. - Clear the fault.
- Send the goal again.
This time, the robot reaches the goal.
The offline moment shown in the post is a recording aid rather than a full network outage. An optional script temporarily disconnects only the operator’s foxglove_bridge, which is why the dashboard can continue updating on screen. The underlying behavior is real: the gateway and fault manager run on the robot, and they continue detecting and recording the failure while the operator is disconnected.
Next steps
The four panels described above are available now in the ros2_medkit_foxglove_extension. They work with the current ros2_medkit gateway in both the Foxglove desktop and web apps.
The OTA system used in this demo is intentionally development-grade. It does not yet include the safeguards required for production deployment, such as artifact signing, A/B partitions, automatic health-gated rollback, staged rollouts across a fleet, or a complete audit log.
For now, it is intended for prototypes, lab robots, and internal demonstrations.
The next steps for the extension are to expose more entity operations directly in the panels and provide richer links between faults and their associated captures.
If you’re building something similar or want to talk SOVD diagnostics, OTA updates, and robotics visualization, come join us in our Discord community. We’d love to see what you’re working on, answer your questions, and hear your feedback.
Resources
- ros2_medkit and the docs - the SOVD gateway for ROS 2
- ros2_medkit_foxglove_extension - the extension and its
.foxebuild - selfpatch_demos - the
ota_nav2_sensor_fixdemo - Foxglove Documentation - the Foxglove primitives the extension builds on
About the Author
Bartosz Burda works on ros2_medkit at selfpatch.ai, a company building a diagnostic layer for robots, PLCs, and software-defined devices.