Visualizing the Artemis II Mission
Orion's real trajectory, hundreds of mission photos, and a custom photo-stepper extension — all replayable on one Foxglove timeline
In April 2026, four astronauts flew around the Moon for the first time in over fifty years. Hank Green, a science communicator and YouTuber, built an awesome website to visualize the many photos taken on and around the spacecraft throughout the mission.
I was inspired by Hank’s project (as I am by most of his projects and content), and as a recent addition to the Foxglove team, I saw a great opportunity to both learn our tool and explore the same dataset in a new way.
Foxglove is built for robotics, it organizes and visualizes the sensor data that goes into developing and debugging autonomous systems. The same tools generalize well beyond robots, and it’s a genuinely fun environment to build things in.
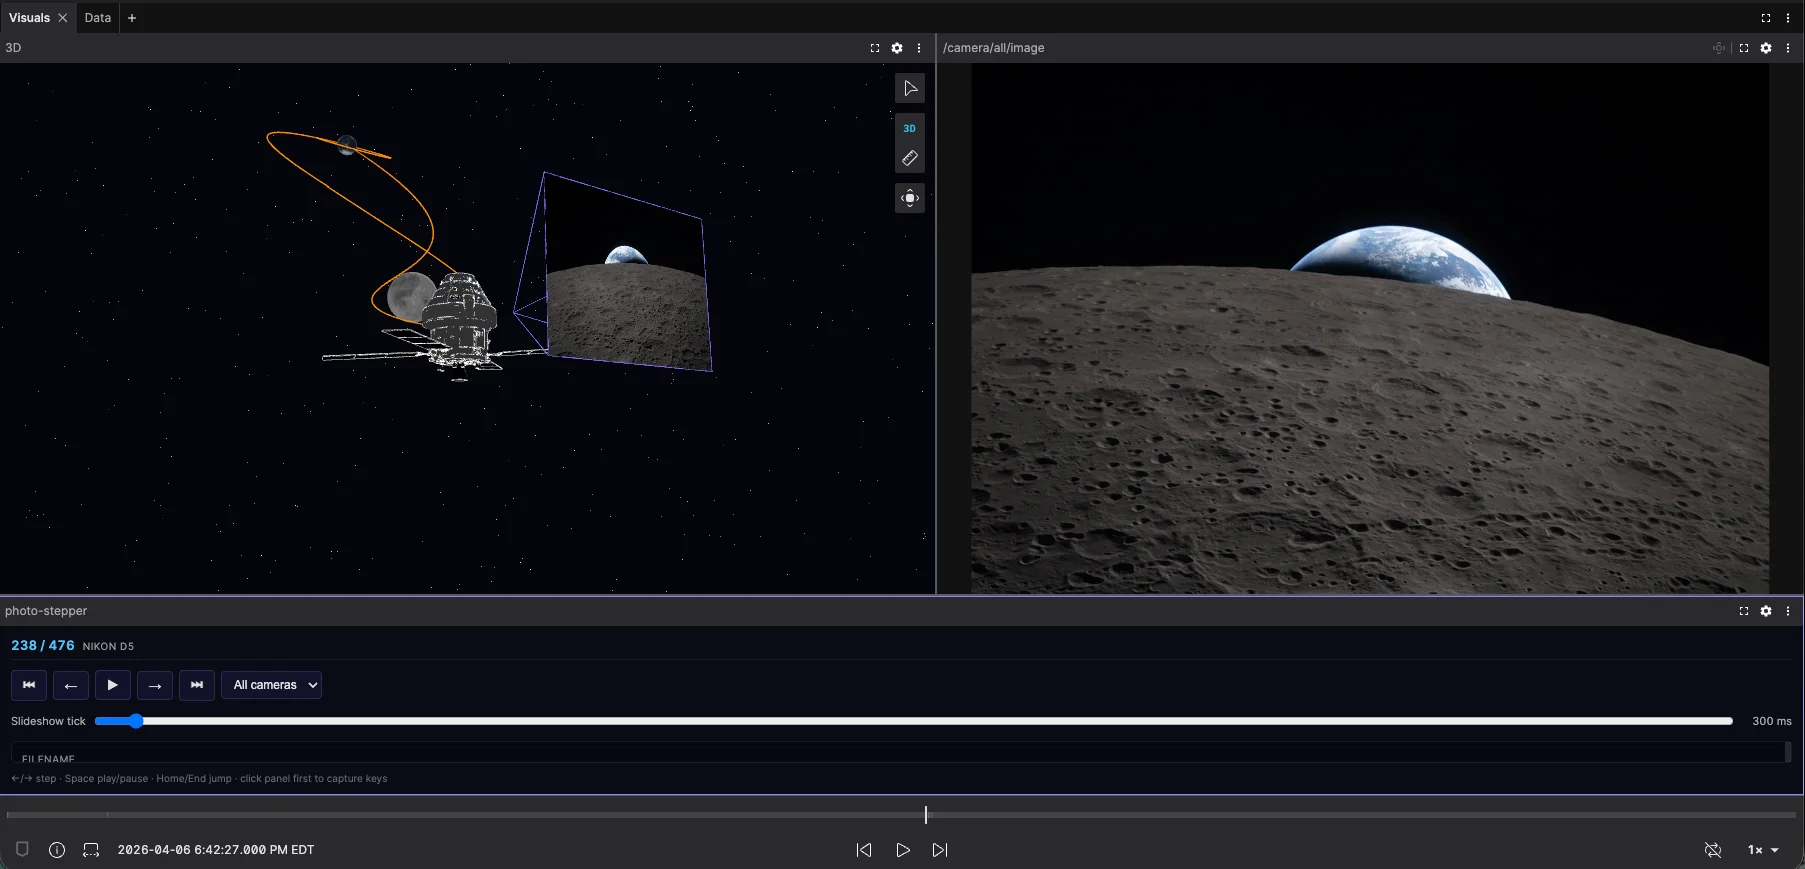
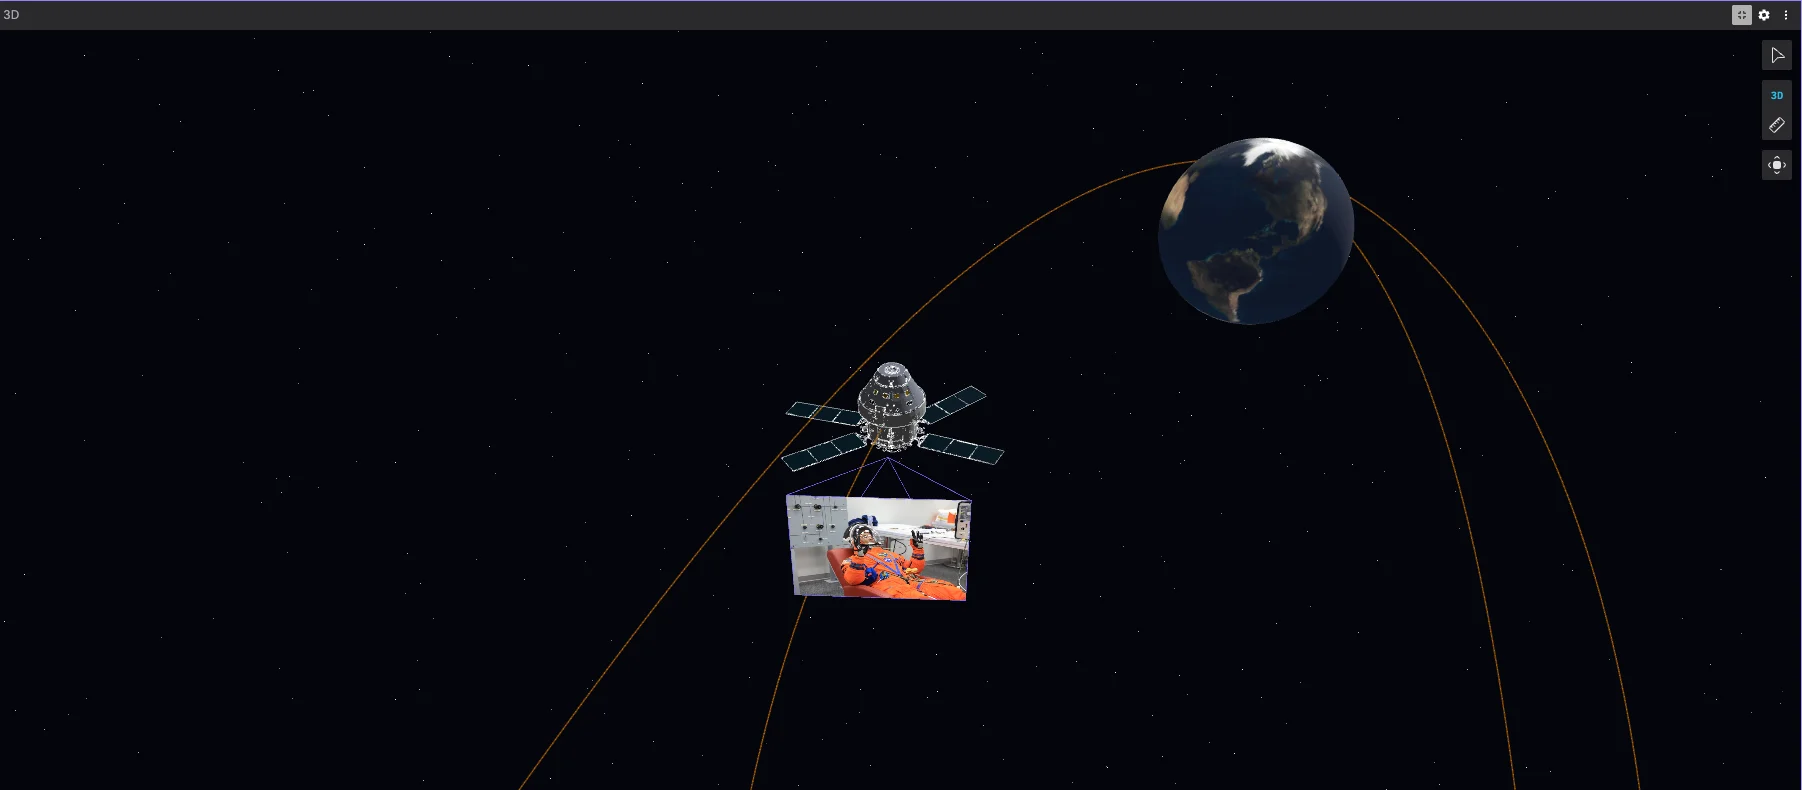
I knew I could use the 3D panel to plot Orion’s actual path through inertial space; something you can rotate, zoom into, and follow in real time, while a second tab kept the photos and mission state synchronized to wherever you were in the timeline.
Getting the Data
The pipeline started with two sources. Orion’s trajectory came from the JPL Horizons API, which provides precise ephemeris data for solar system objects including crewed spacecraft. The photos and their metadata came from Hank’s Artemis-Timeline project, where a single photos.js file captures everything: timestamp, camera type, caption, photographer, and a link to the full-resolution JPEG for each shot.
A few Python scripts handle the rest. One fetches the trajectory, one downloads and resizes the photos from their original multi-megabyte RAW exports down to a more manageable ~1280px, and a third fuses everything onto a single synchronized timeline and writes it out as an MCAP file. Simple enough in hindsight, though getting the timestamps to line up cleanly took a few passes.
Building the 3D Scene
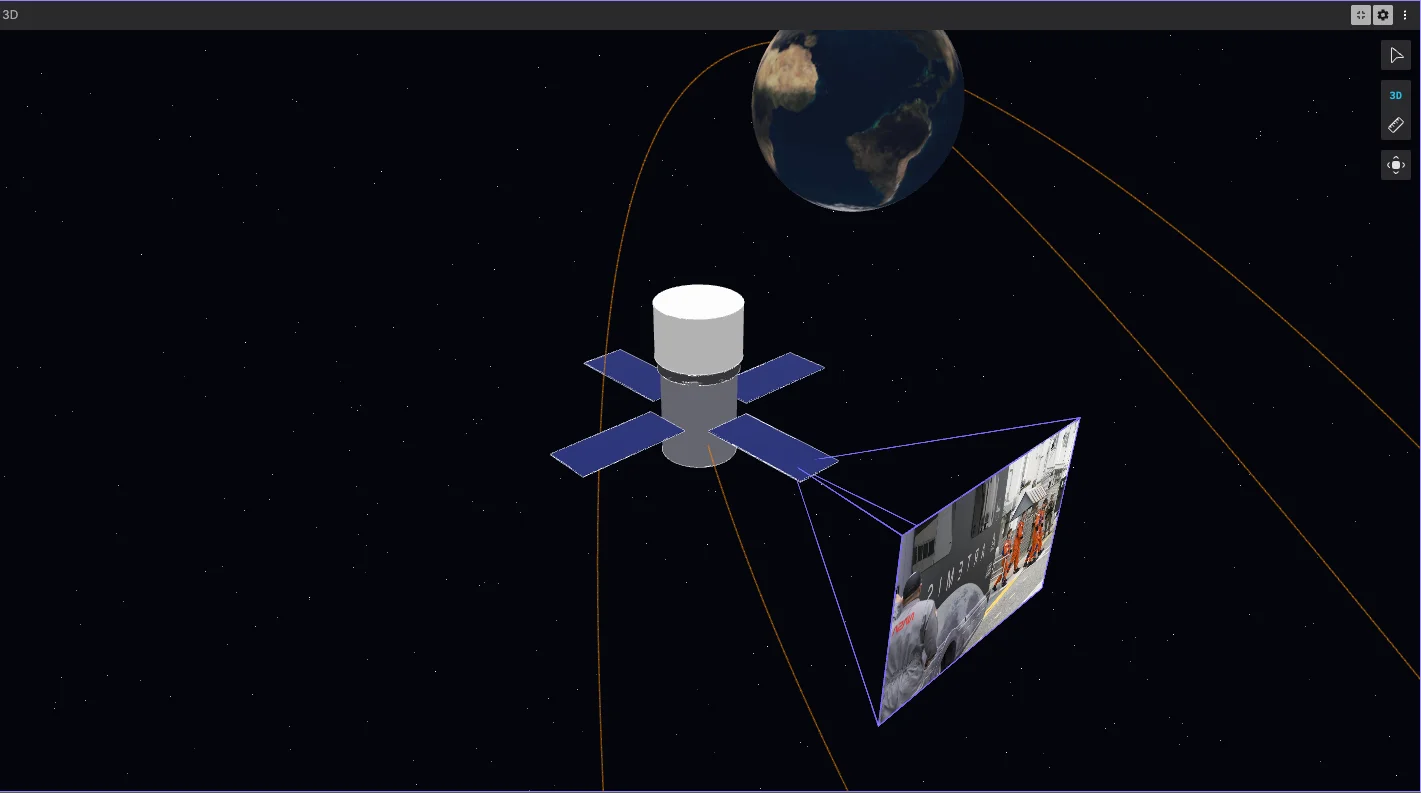
Now that I had all the data I needed, the next step was to build out the 3D scene to follow the trajectory. Early on I tried a primitive URDF; boxes and cylinders roughly standing in for the spacecraft. It worked, but it didn’t feel like Orion.
Then I found Ian Dees’s artemis-viewer on GitHub. It uses NASA’s AROW Orion model, the same one from NASA’s live Artemis tracker, with solar arrays that actually look like solar arrays. I wired that into the MCAP and reused Ian’s tuned panel deployment poses, so the arrays sit in their on-orbit configuration rather than folded against the hull.
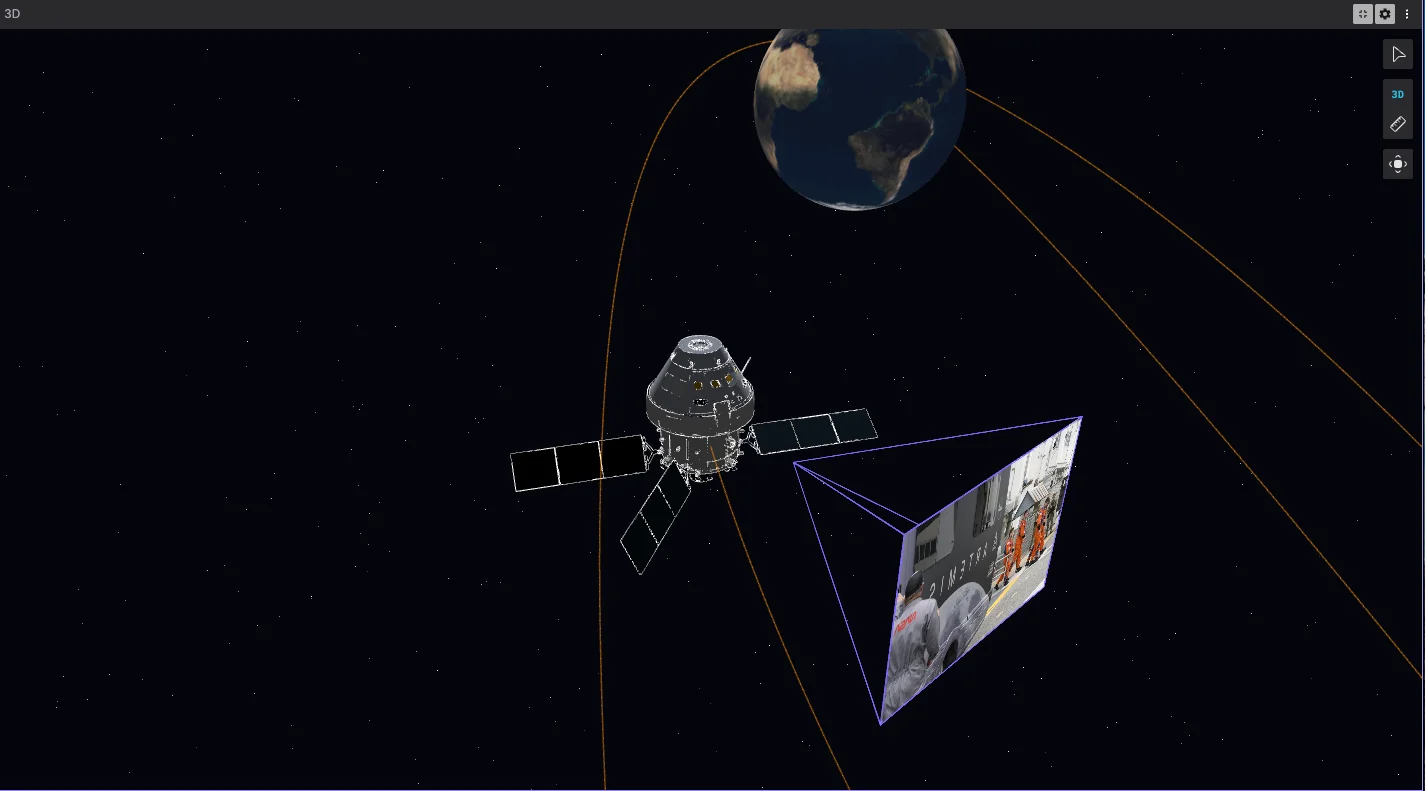
Layout: Less Clutter, More Visuals
At first everything lived on one screen: 3D view, plots, timeline, photos, logs. It was informative, but busy. I wanted the orbital view and images to be emphasized.
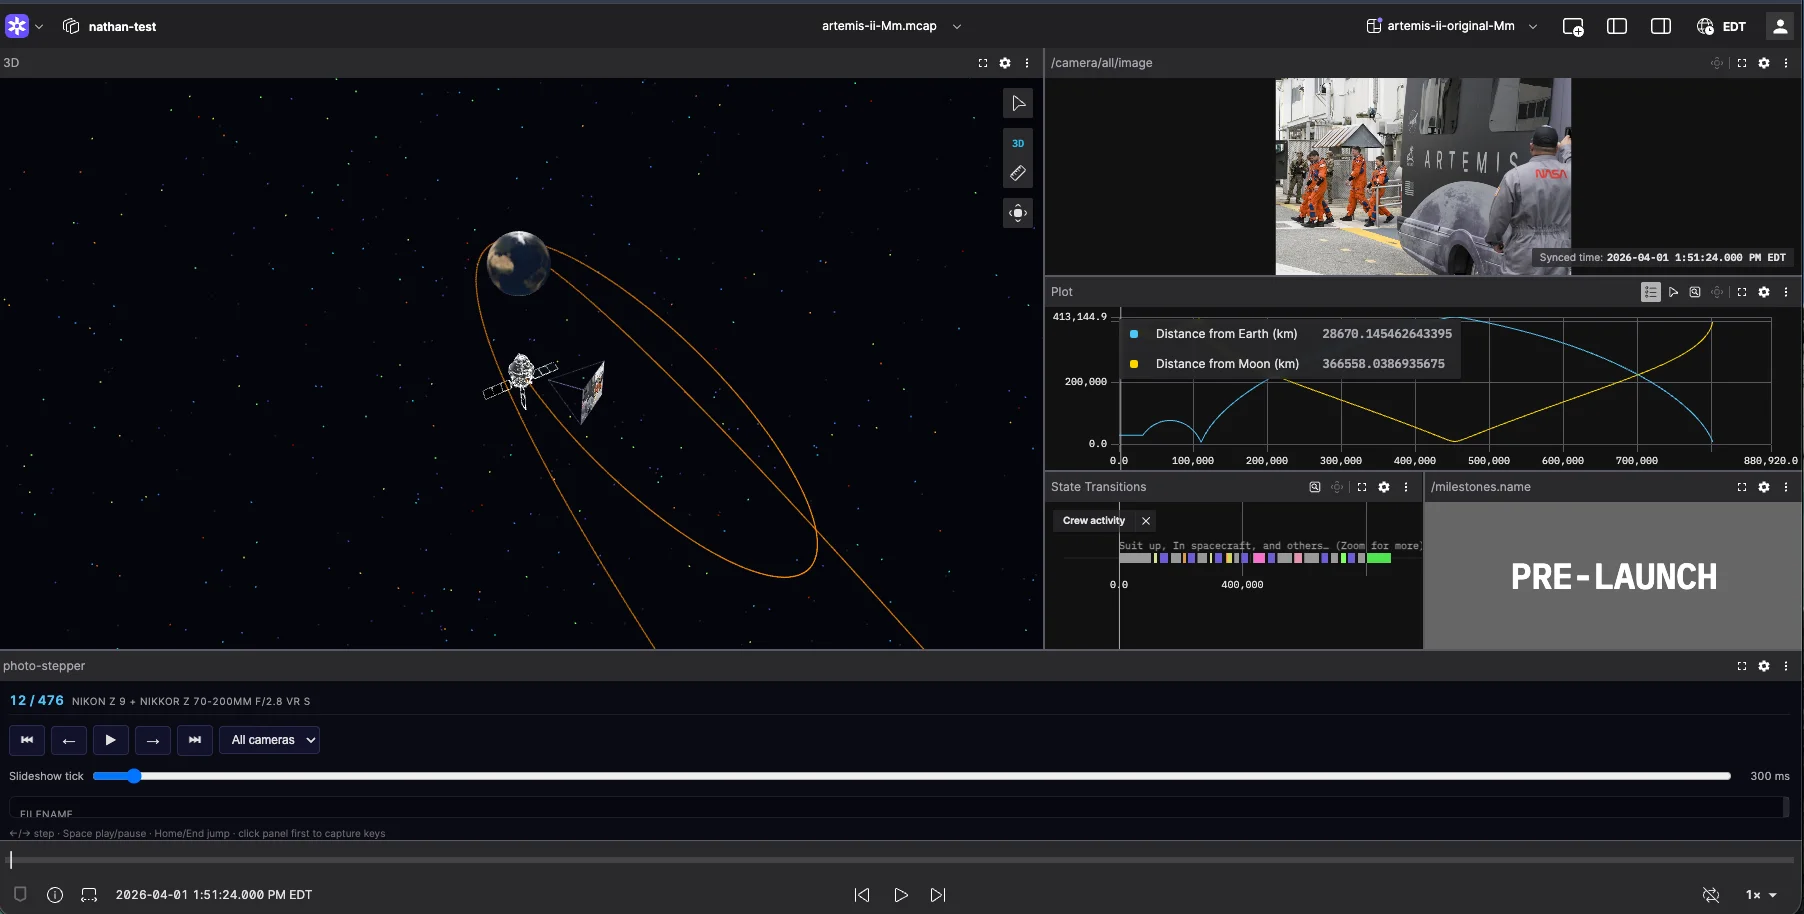
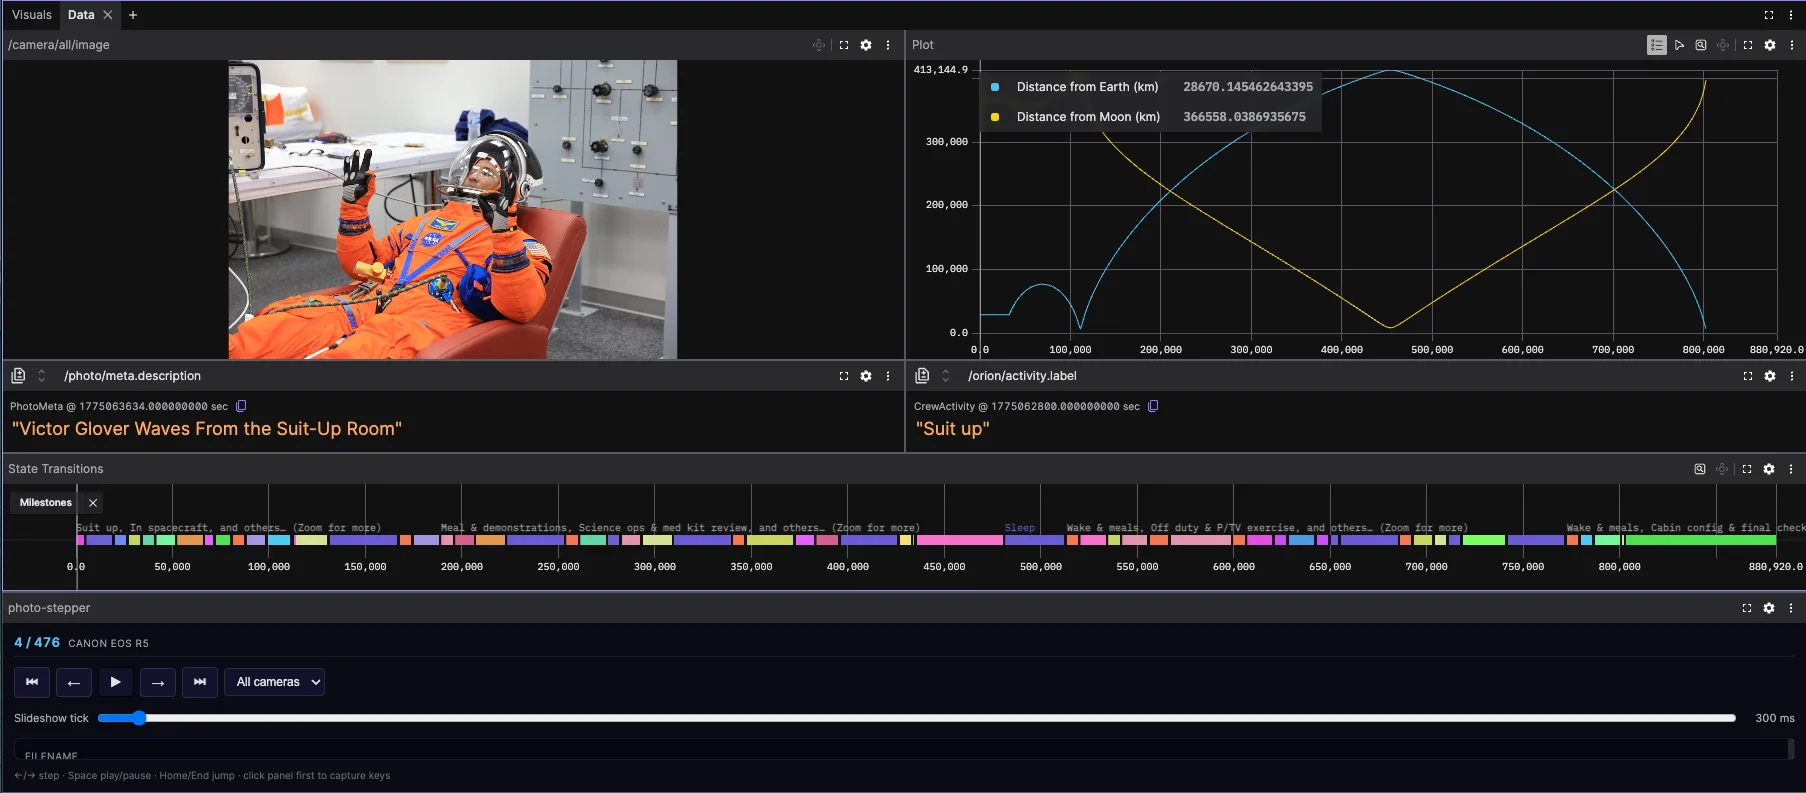
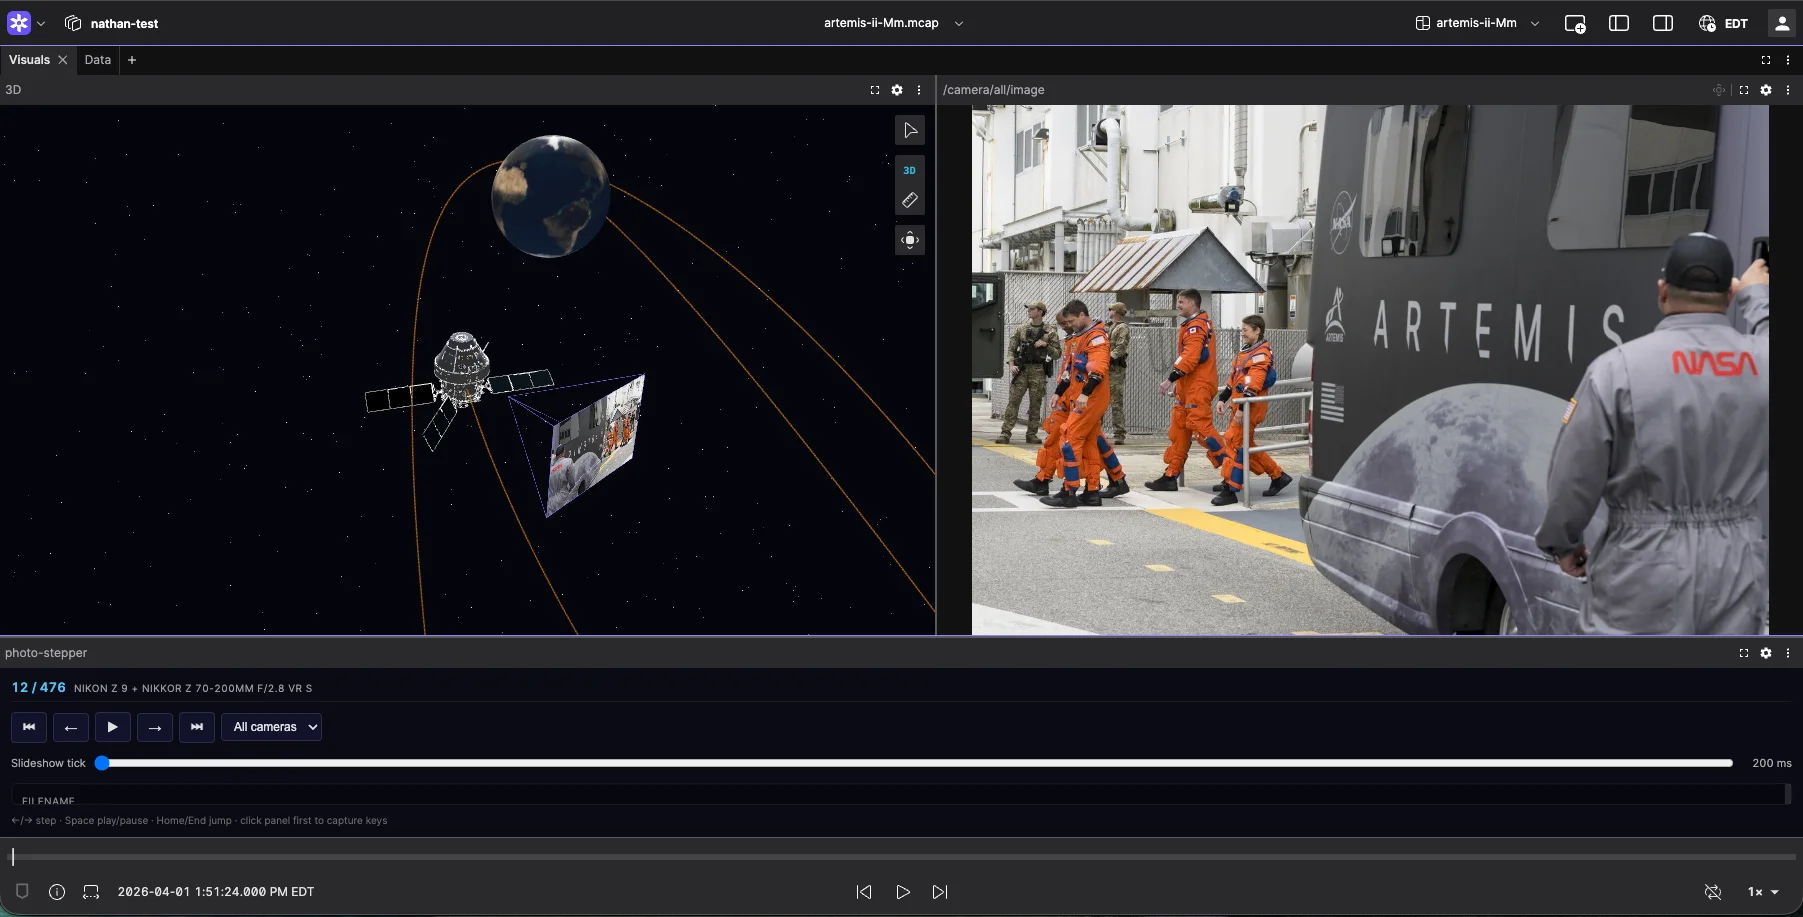
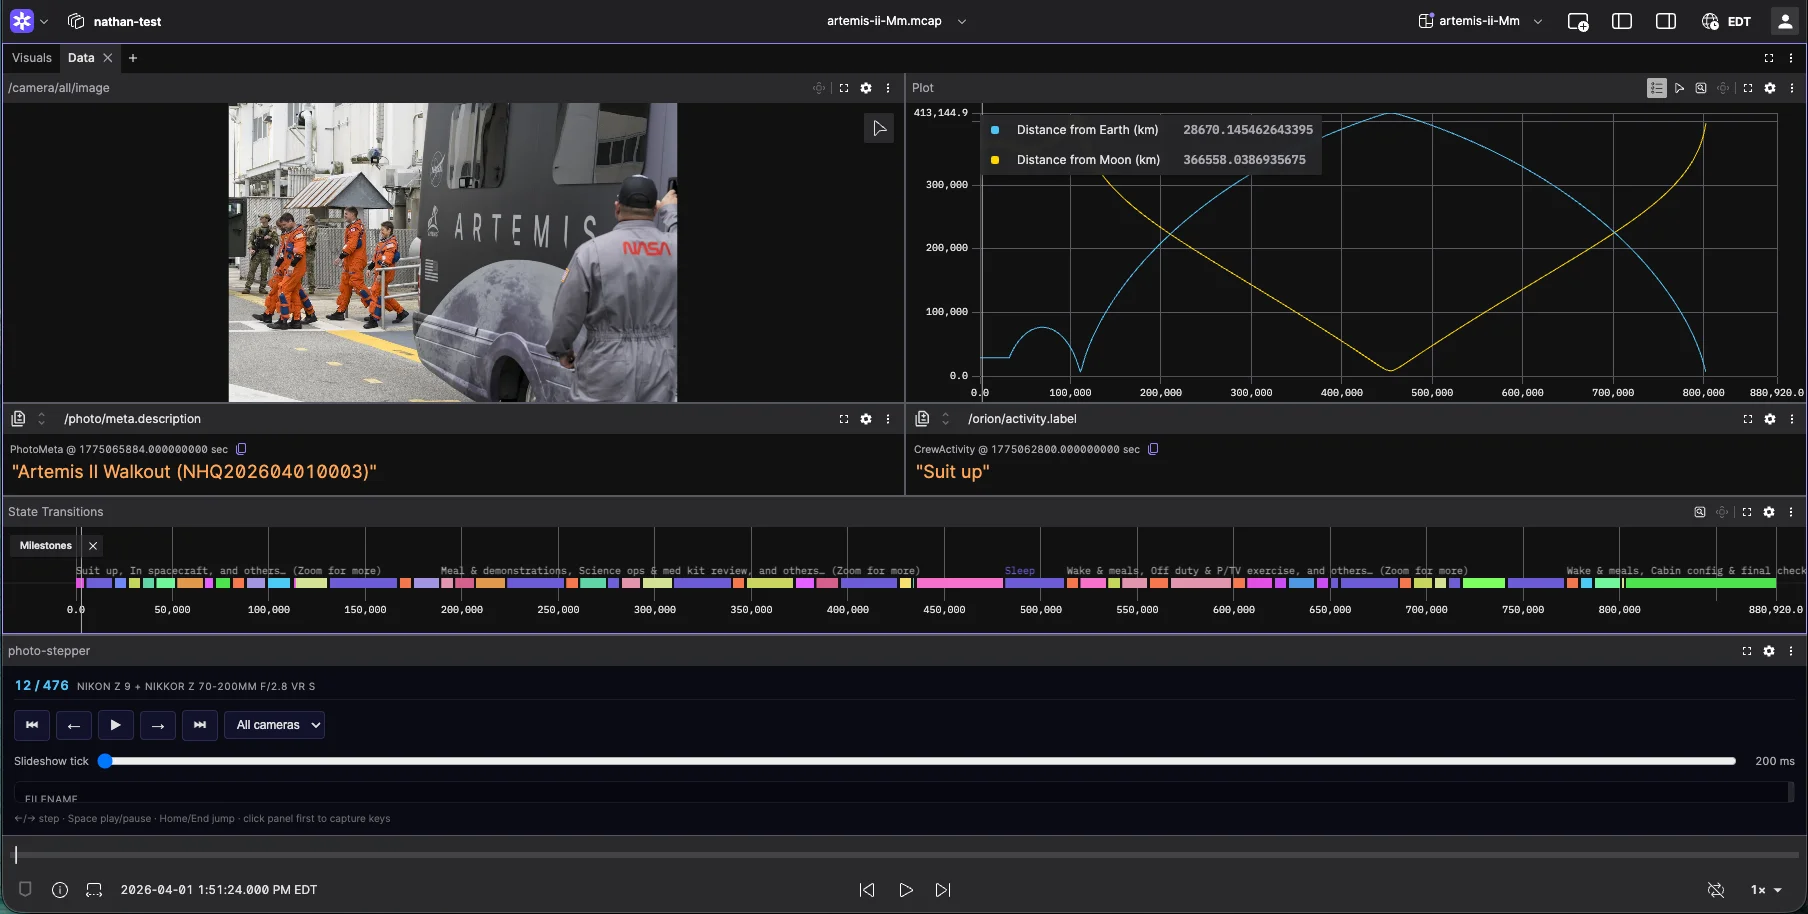
So I split the layout into a tab panel with two tabs: one focused on data and pictures, one on the 3D panel and pictures. You can dig into distance plots and mission state when you want the numbers, then switch to the visual tab when you just want to watch Orion move through space alongside the photos.
Visuals Tab
Data Tab
The Power of Extensions
Foxglove ships with a powerful suite of built-in panels, but the extension system is where things get interesting. Extensions let you build custom panels that plug directly into a layout and share the same timeline as everything else.
For this project, that meant a photo stepper panel: jump forward and backward through shots one at a time, filter by camera, or run a slideshow. The mission spans 10 days and nearly 500 photos, so having dedicated controls made navigating the album actually enjoyable.
The best part is that stepping to a new photo moves the entire layout with it. The 3D view, distance plots, and milestone indicator all snap to that moment in the mission automatically. One timeline, shared across every panel. The photo stepper is on GitHub alongside the rest of the project if you want a working example to start from.
Finishing Touches
Toward the end I added a randomized starfield and textured Earth and Moon models. At mission scale, the scene can feel sparse; the stars and planet textures give it a bit of depth without getting in the way of the trajectory and photos.
Credits
- Trajectory: JPL Horizons / NASA
- Photos & timeline data: Hank Green’s Artemis-Timeline
- Orion model & solar panel poses: Ian Dees’s artemis-viewer (AROW model from NASA)
- Visualization: Foxglove
Try It!
The full project: build scripts, URDF models, built .mcap, Foxglove layout, and photo stepper extension is on GitHub. You’ll need Python 3.10+, a Foxglove installation, and about 10-30 minutes for the initial build (photo downloads dominate). The README has step-by-step instructions.
If you build something with it, or adapt it for another mission, I’d love to hear about it.