Blog

Announcing H.264 Support in Foxglove
Leverage powerful video codecs to substantially reduce your storage requirements
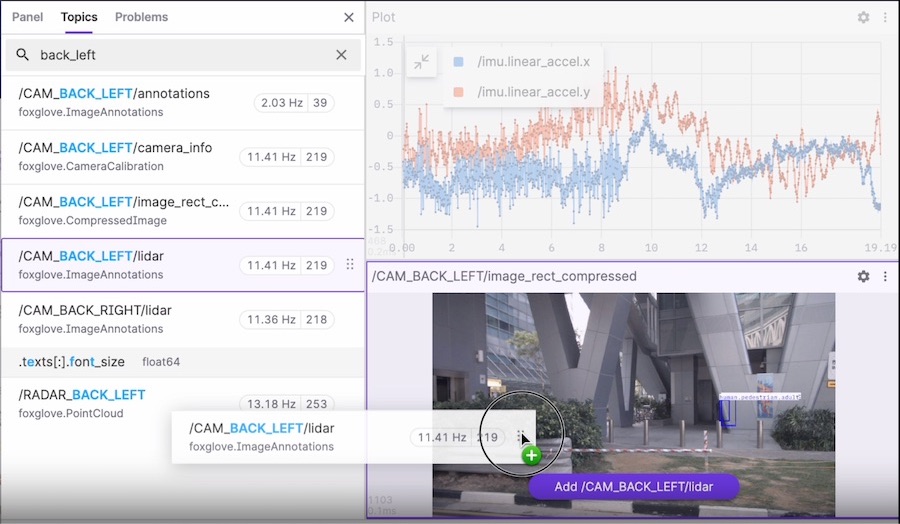
Improved Topic Discovery and Visualization in Foxglove
Drag-and-drop topics into select panels for instant visualization
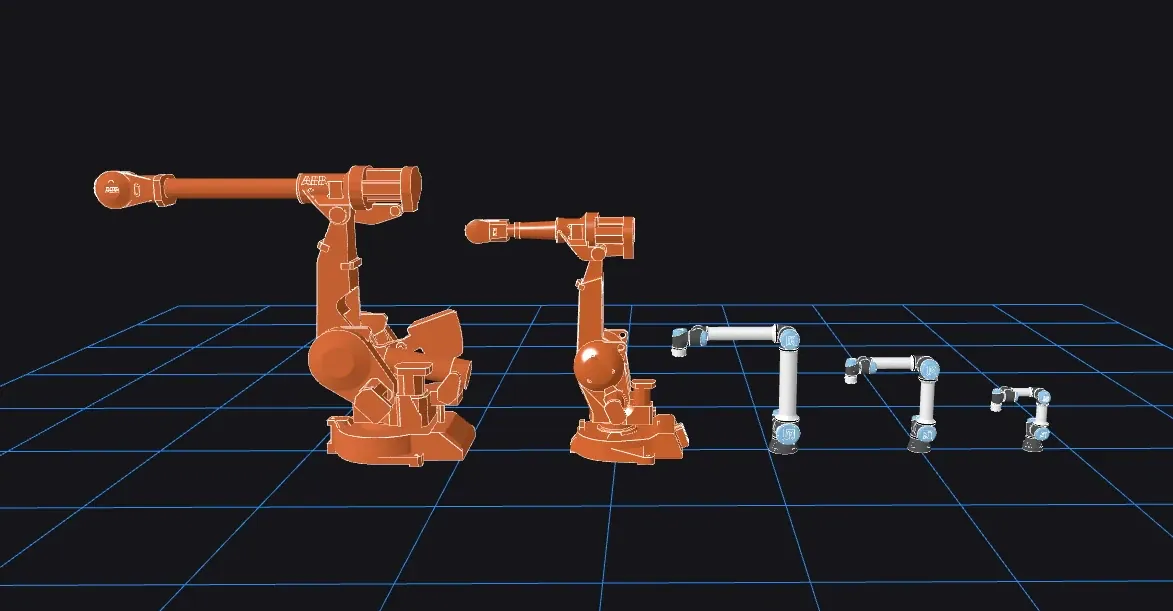
Announcing Foxglove's Improved URDF Support
Fetch remote meshes, use additional URDF sources, and visualize collision geometries
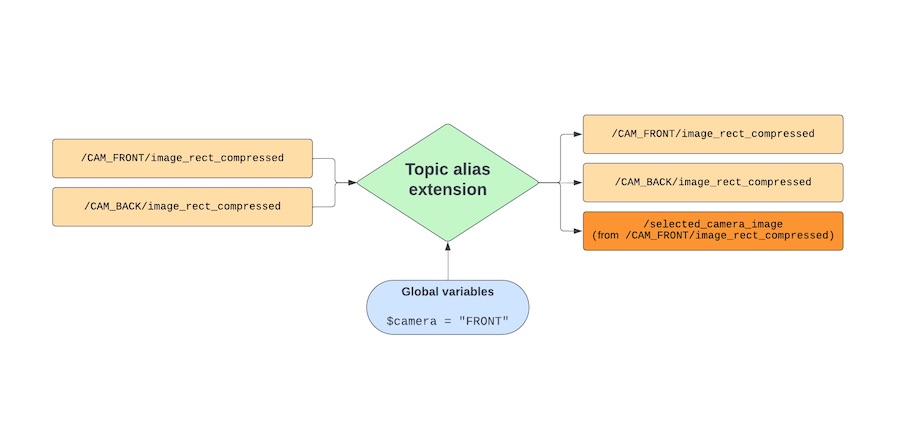
Introducing Topic Alias Extensions in Foxglove
Dynamically rename topics to better organize and navigate complex datasets
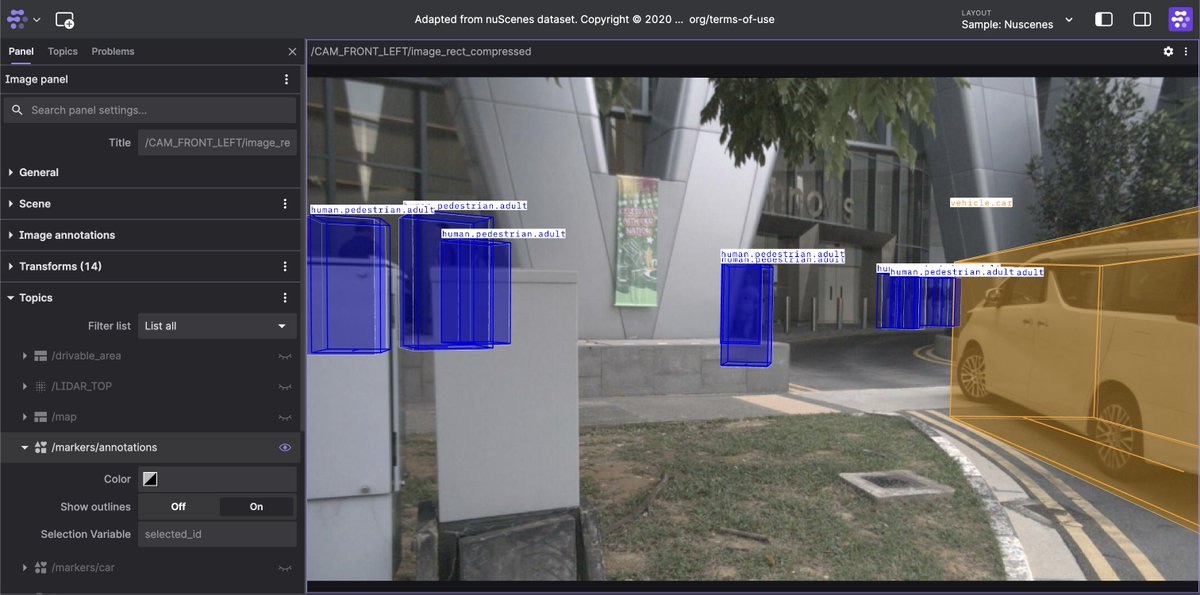
Introducing Foxglove's New Image Panel
Use 2D annotations and 3D markers to add context to your camera images
Simulating Robotic Scenarios with ROS 1 and Gazebo
Visualize simulated sensor data with Foxglove
Leveraging OpenAPI for Foxglove Development
Generating server routes and accurate documentation from an OpenAPI spec
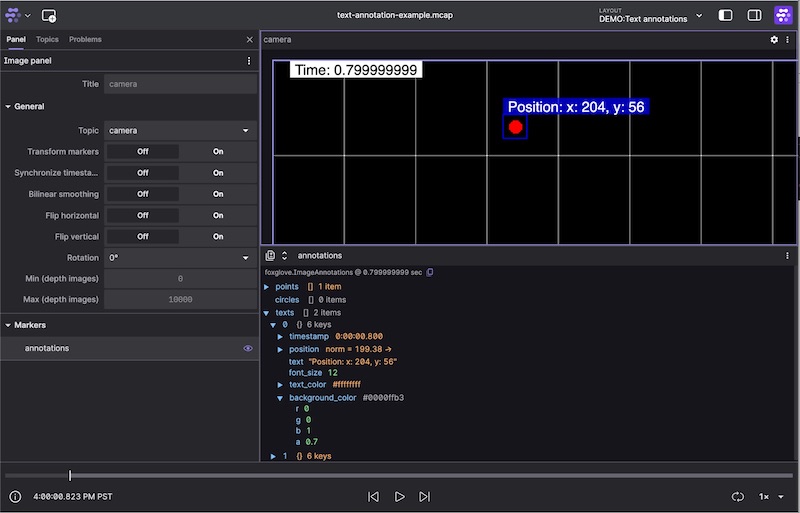
Introducing Text Annotations in Foxglove’s Image Panel
Annotate your robots’ images with metadata for easier debugging
Announcing Microsoft Sign-In
Foxglove adds new SSO options for streamlined account access
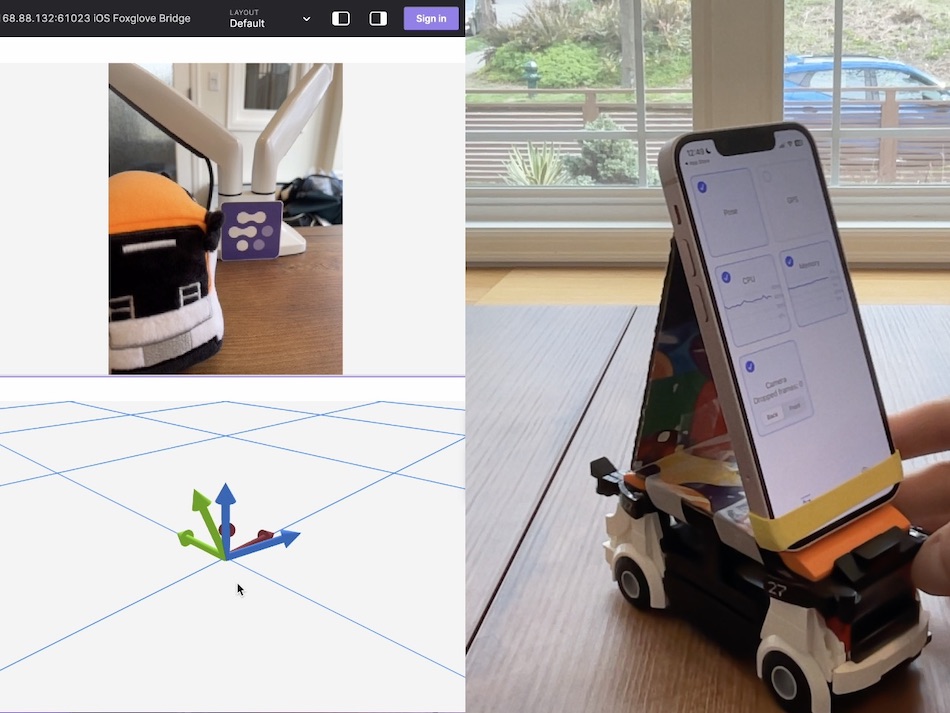
Streaming data from your iPhone to Foxglove
Visualize live data from your iOS device’s cameras and sensors.
The Eclipse-eCAL Project Releases a WebSocket Bridge for Foxglove
Connect your eCAL systems to Foxglove to visualize autonomous driving data
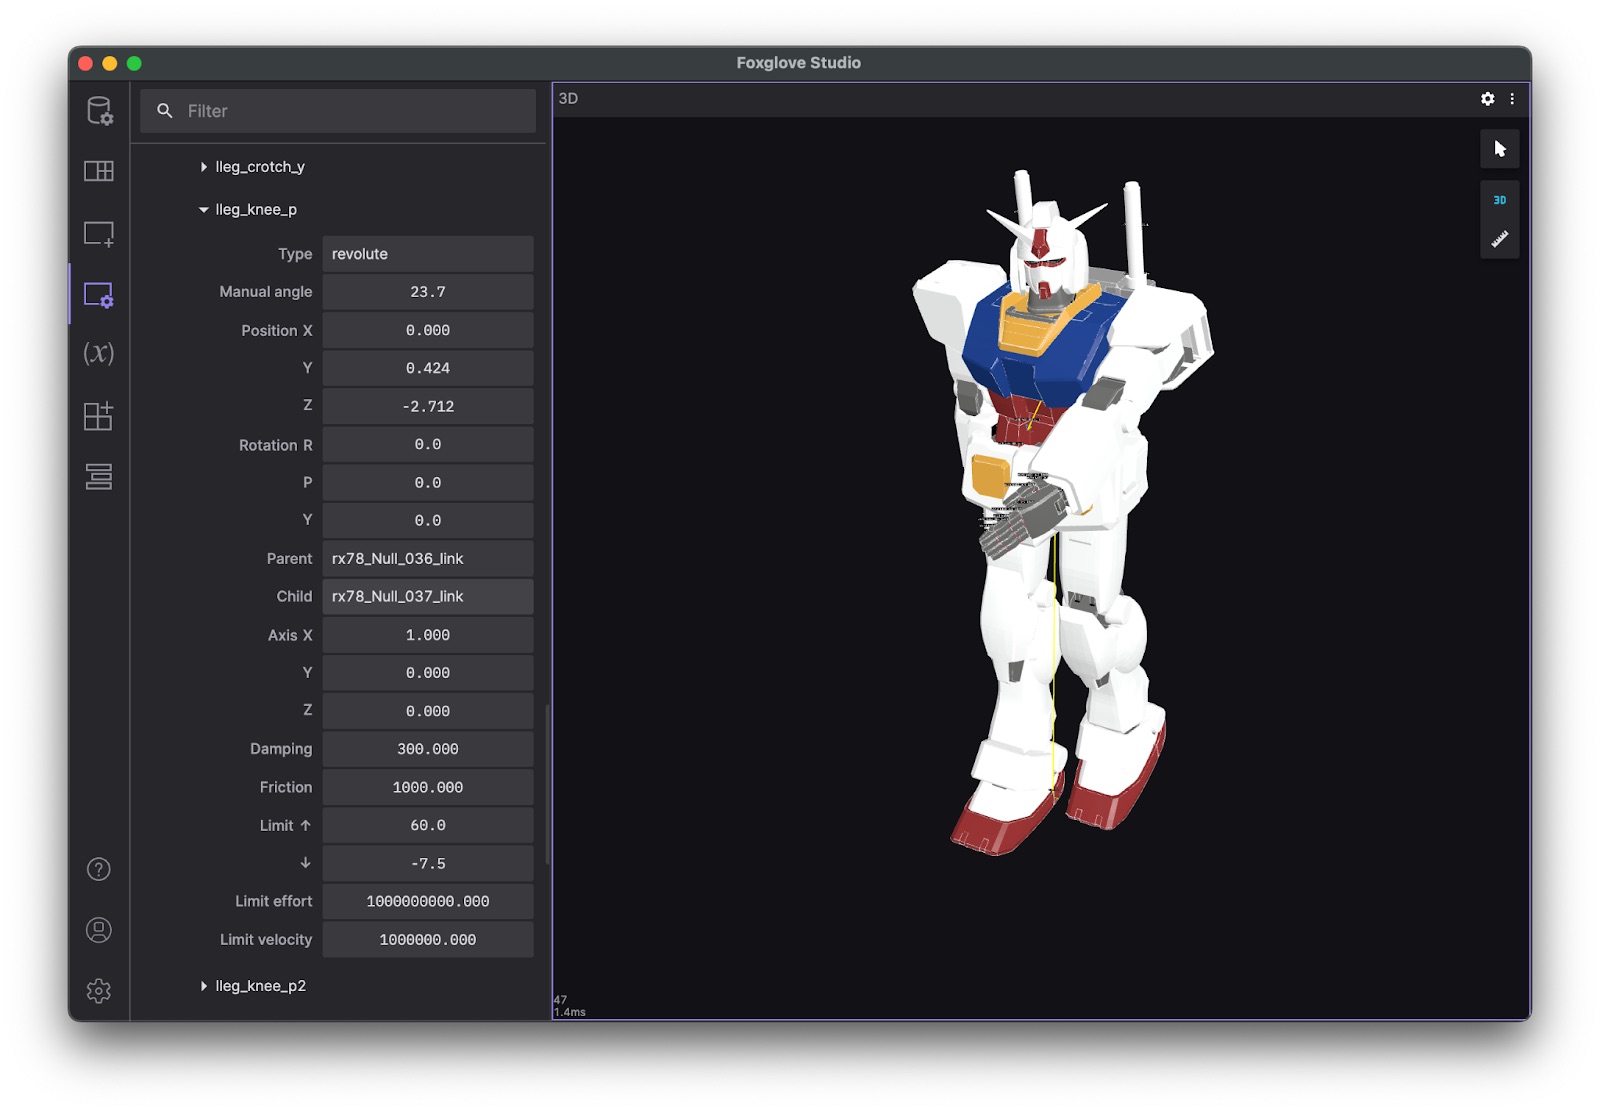
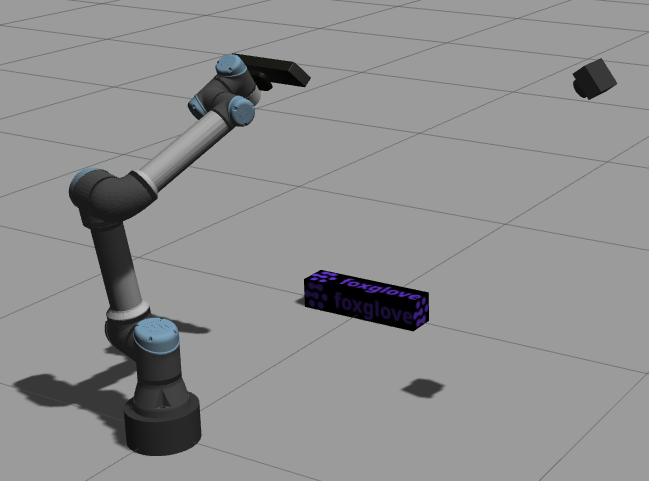
Adding URDFs to Foxglove's 3D Panel
Visualize robot models in the context of a 3D scene

Announcing ROS 2 IDL Support in Foxglove
Integration for the OMG Interface Definition and Language spec
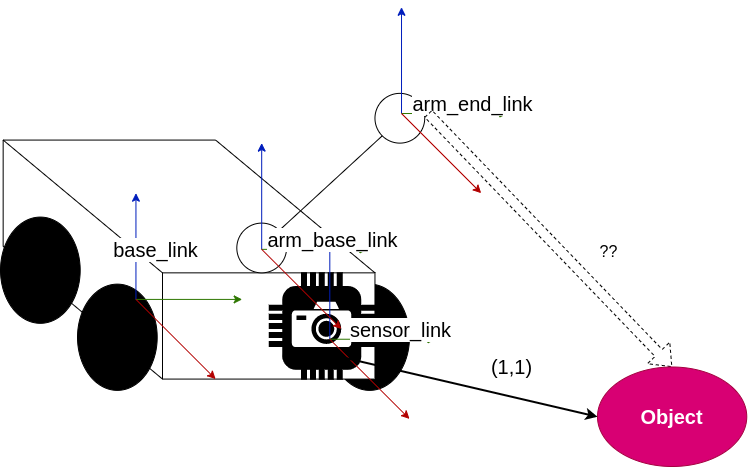
Using ROS 1 Transforms to Calculate Object Positions
Use the ROS 1 tf2 library to calculate the relative positions of detected objects
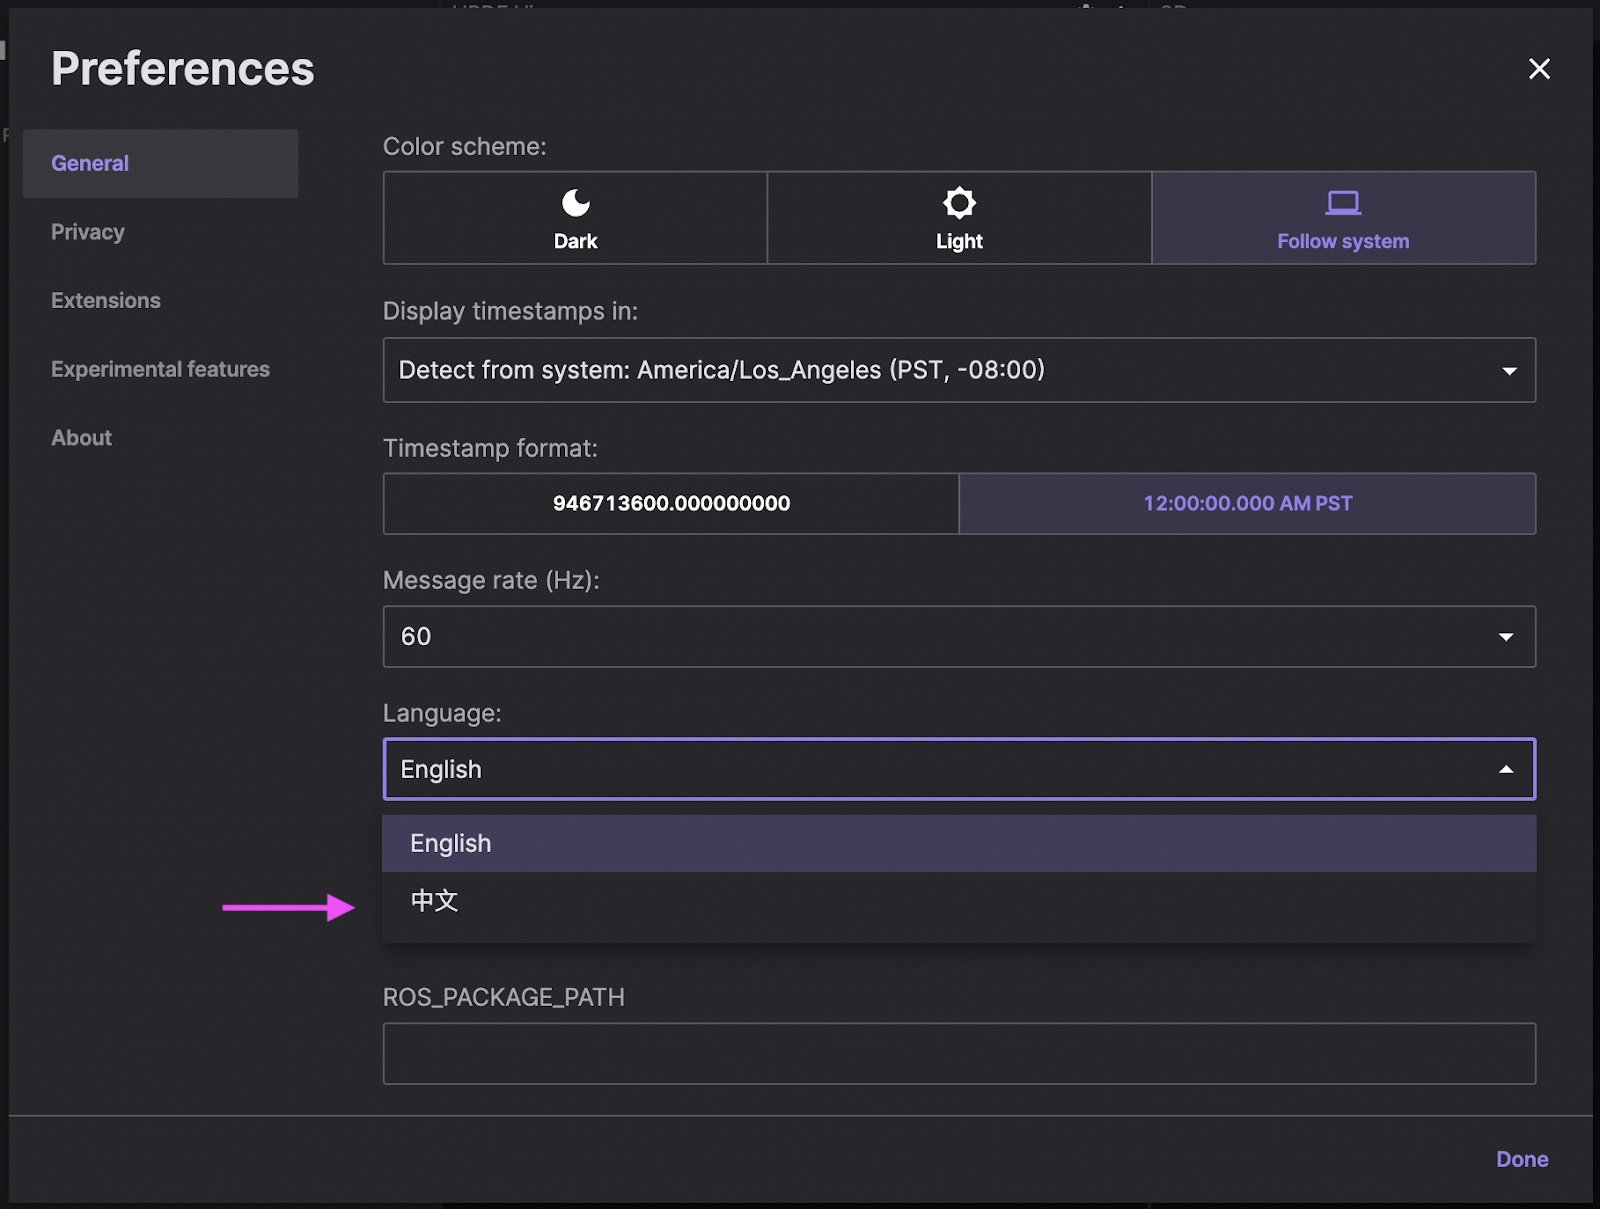
Foxglove 会说中文
Foxglove community member contributes internationalization support
Using ROS 2 Transforms to Calculate Object Positions
Utilize the ROS 2 tf2 library to compute the relative positions of detected objects.
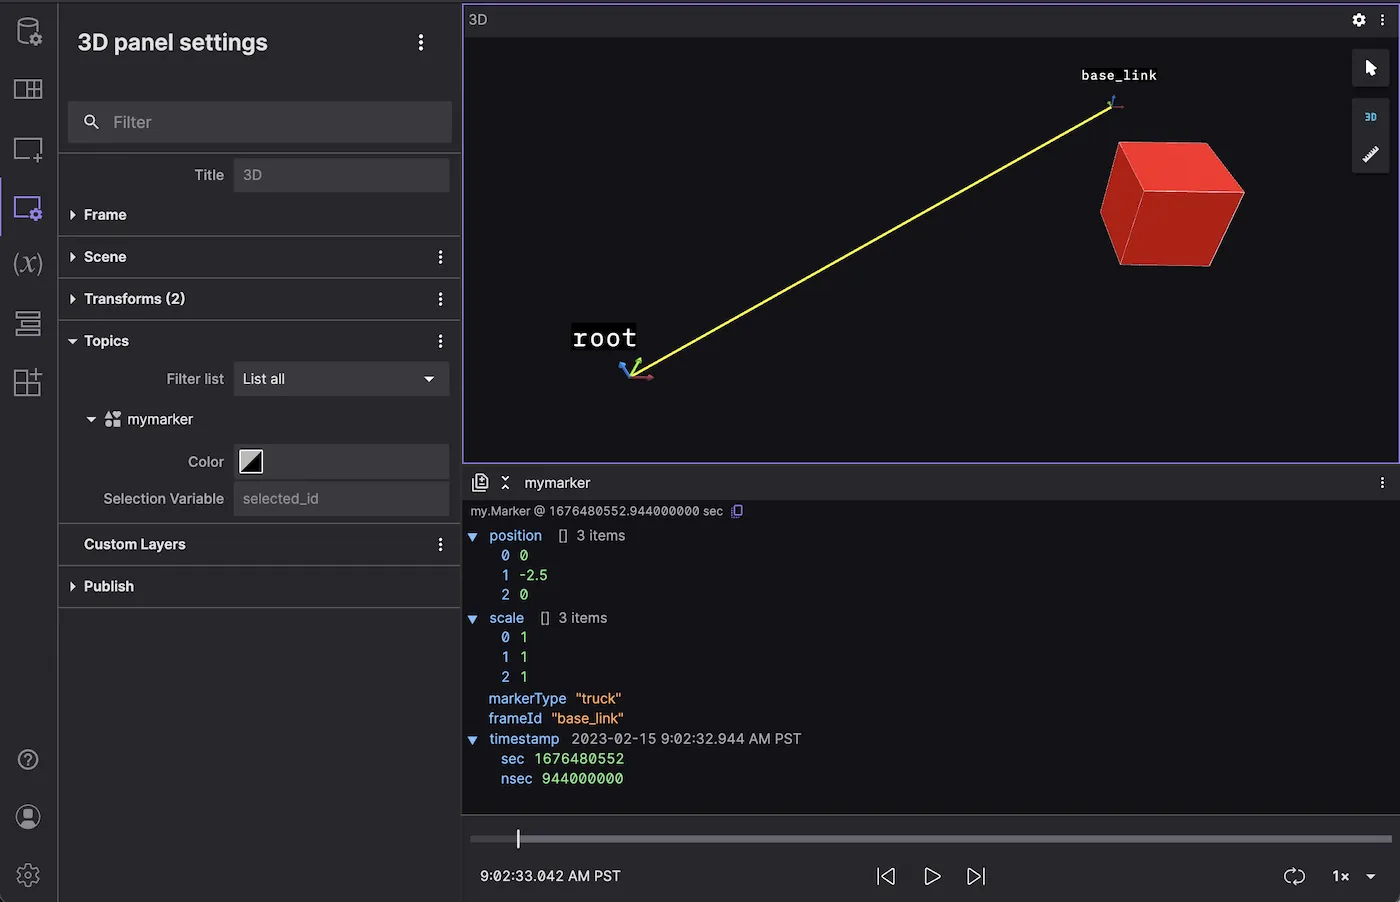
Using Message Converter Extensions to Display 3D Markers in Foxglove
Write a message converter to visualize custom markers in the 3D panel
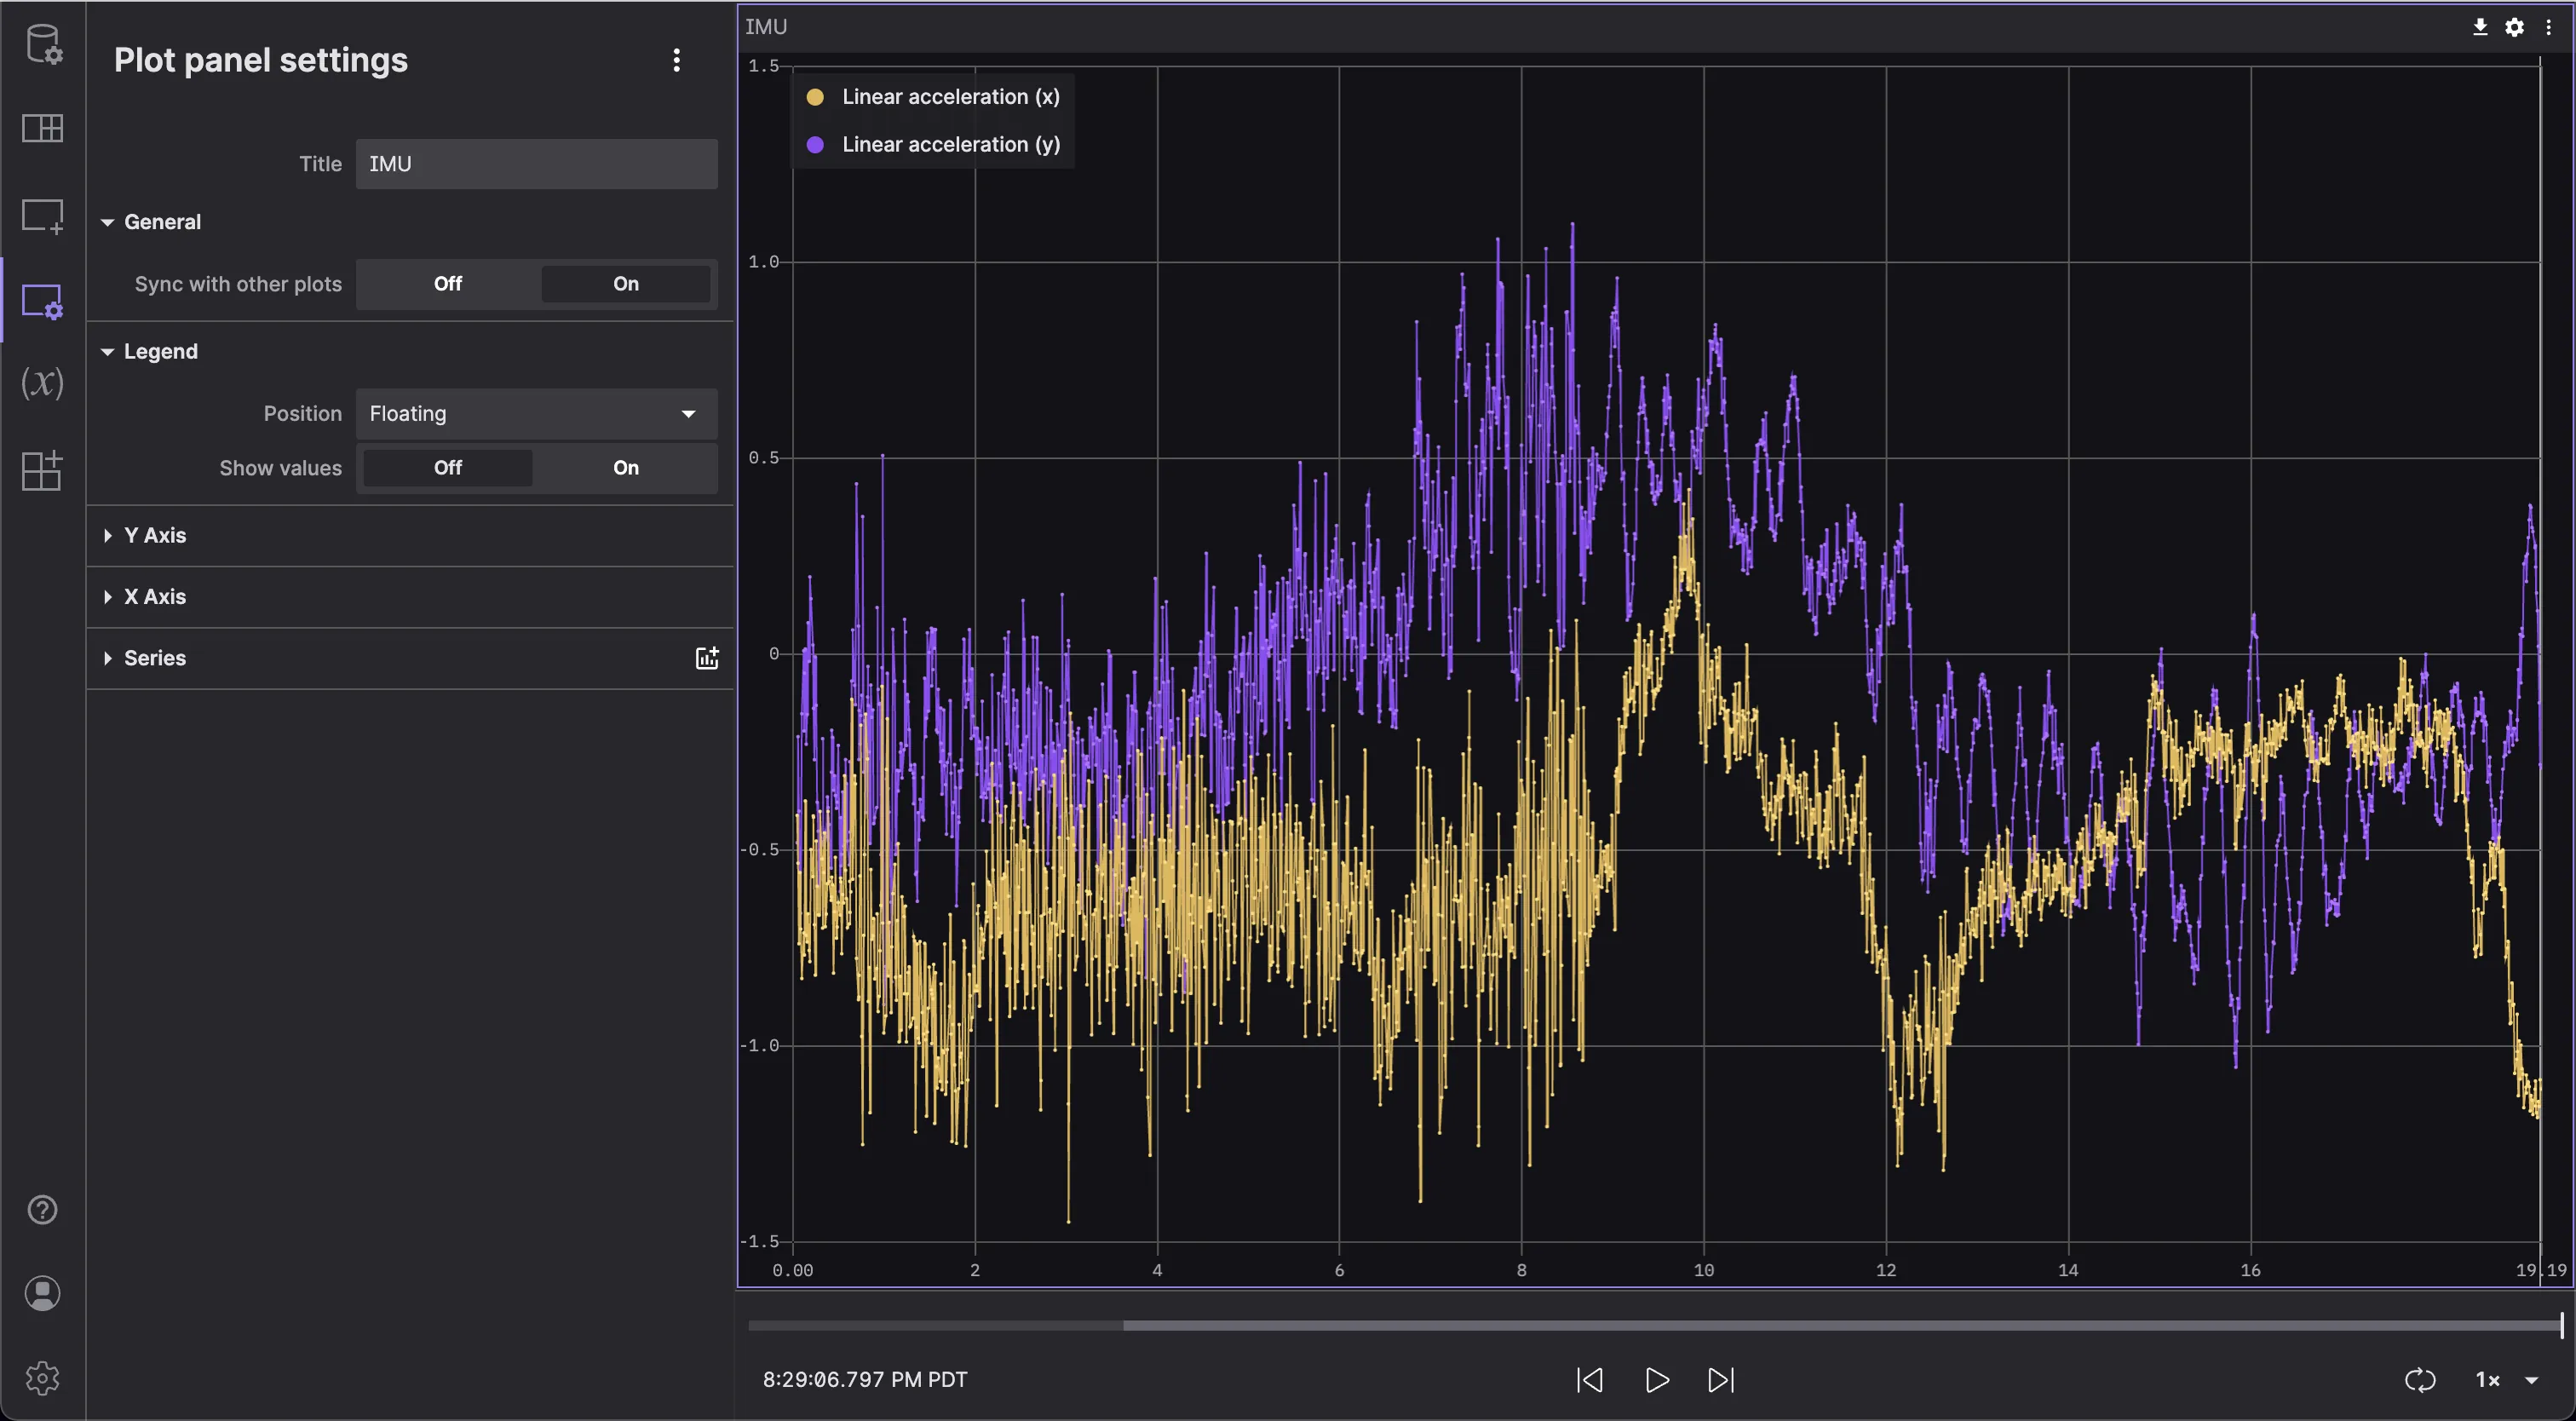
Announcing Foxglove's Improved Plot Settings Interface
Create customizable plots to better understand your robotics data