Industries
Annotate your robotics data with metadata-rich Events with Foxglove
Optimizing message loading and lookup for accurate data analysis
Record and visualize your MCAP data with ROS 2 tooling
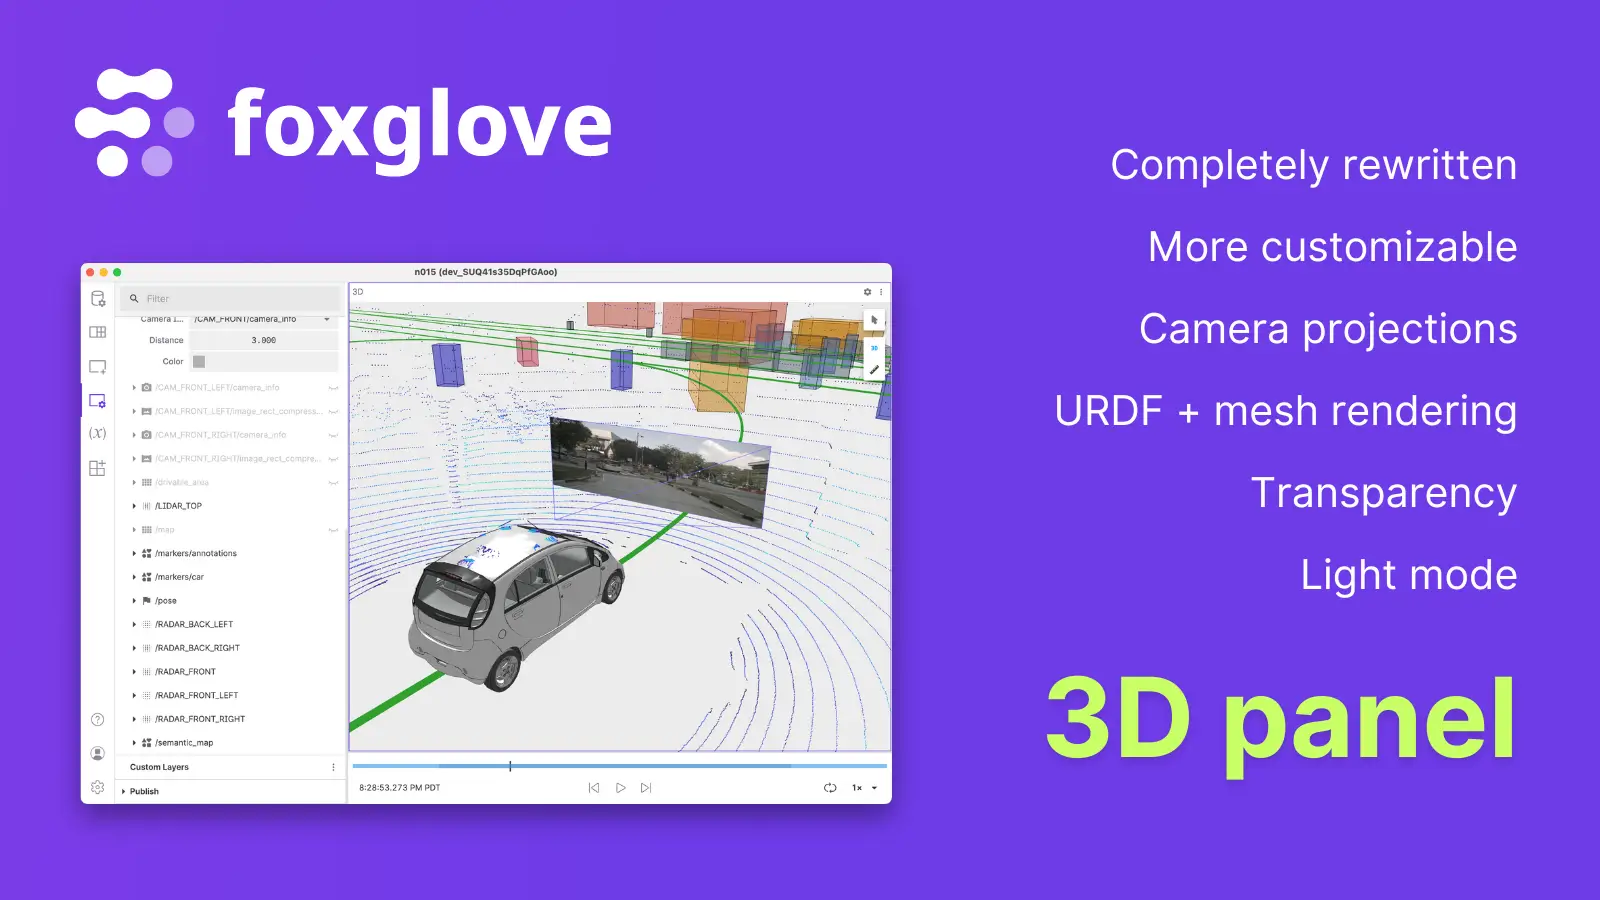
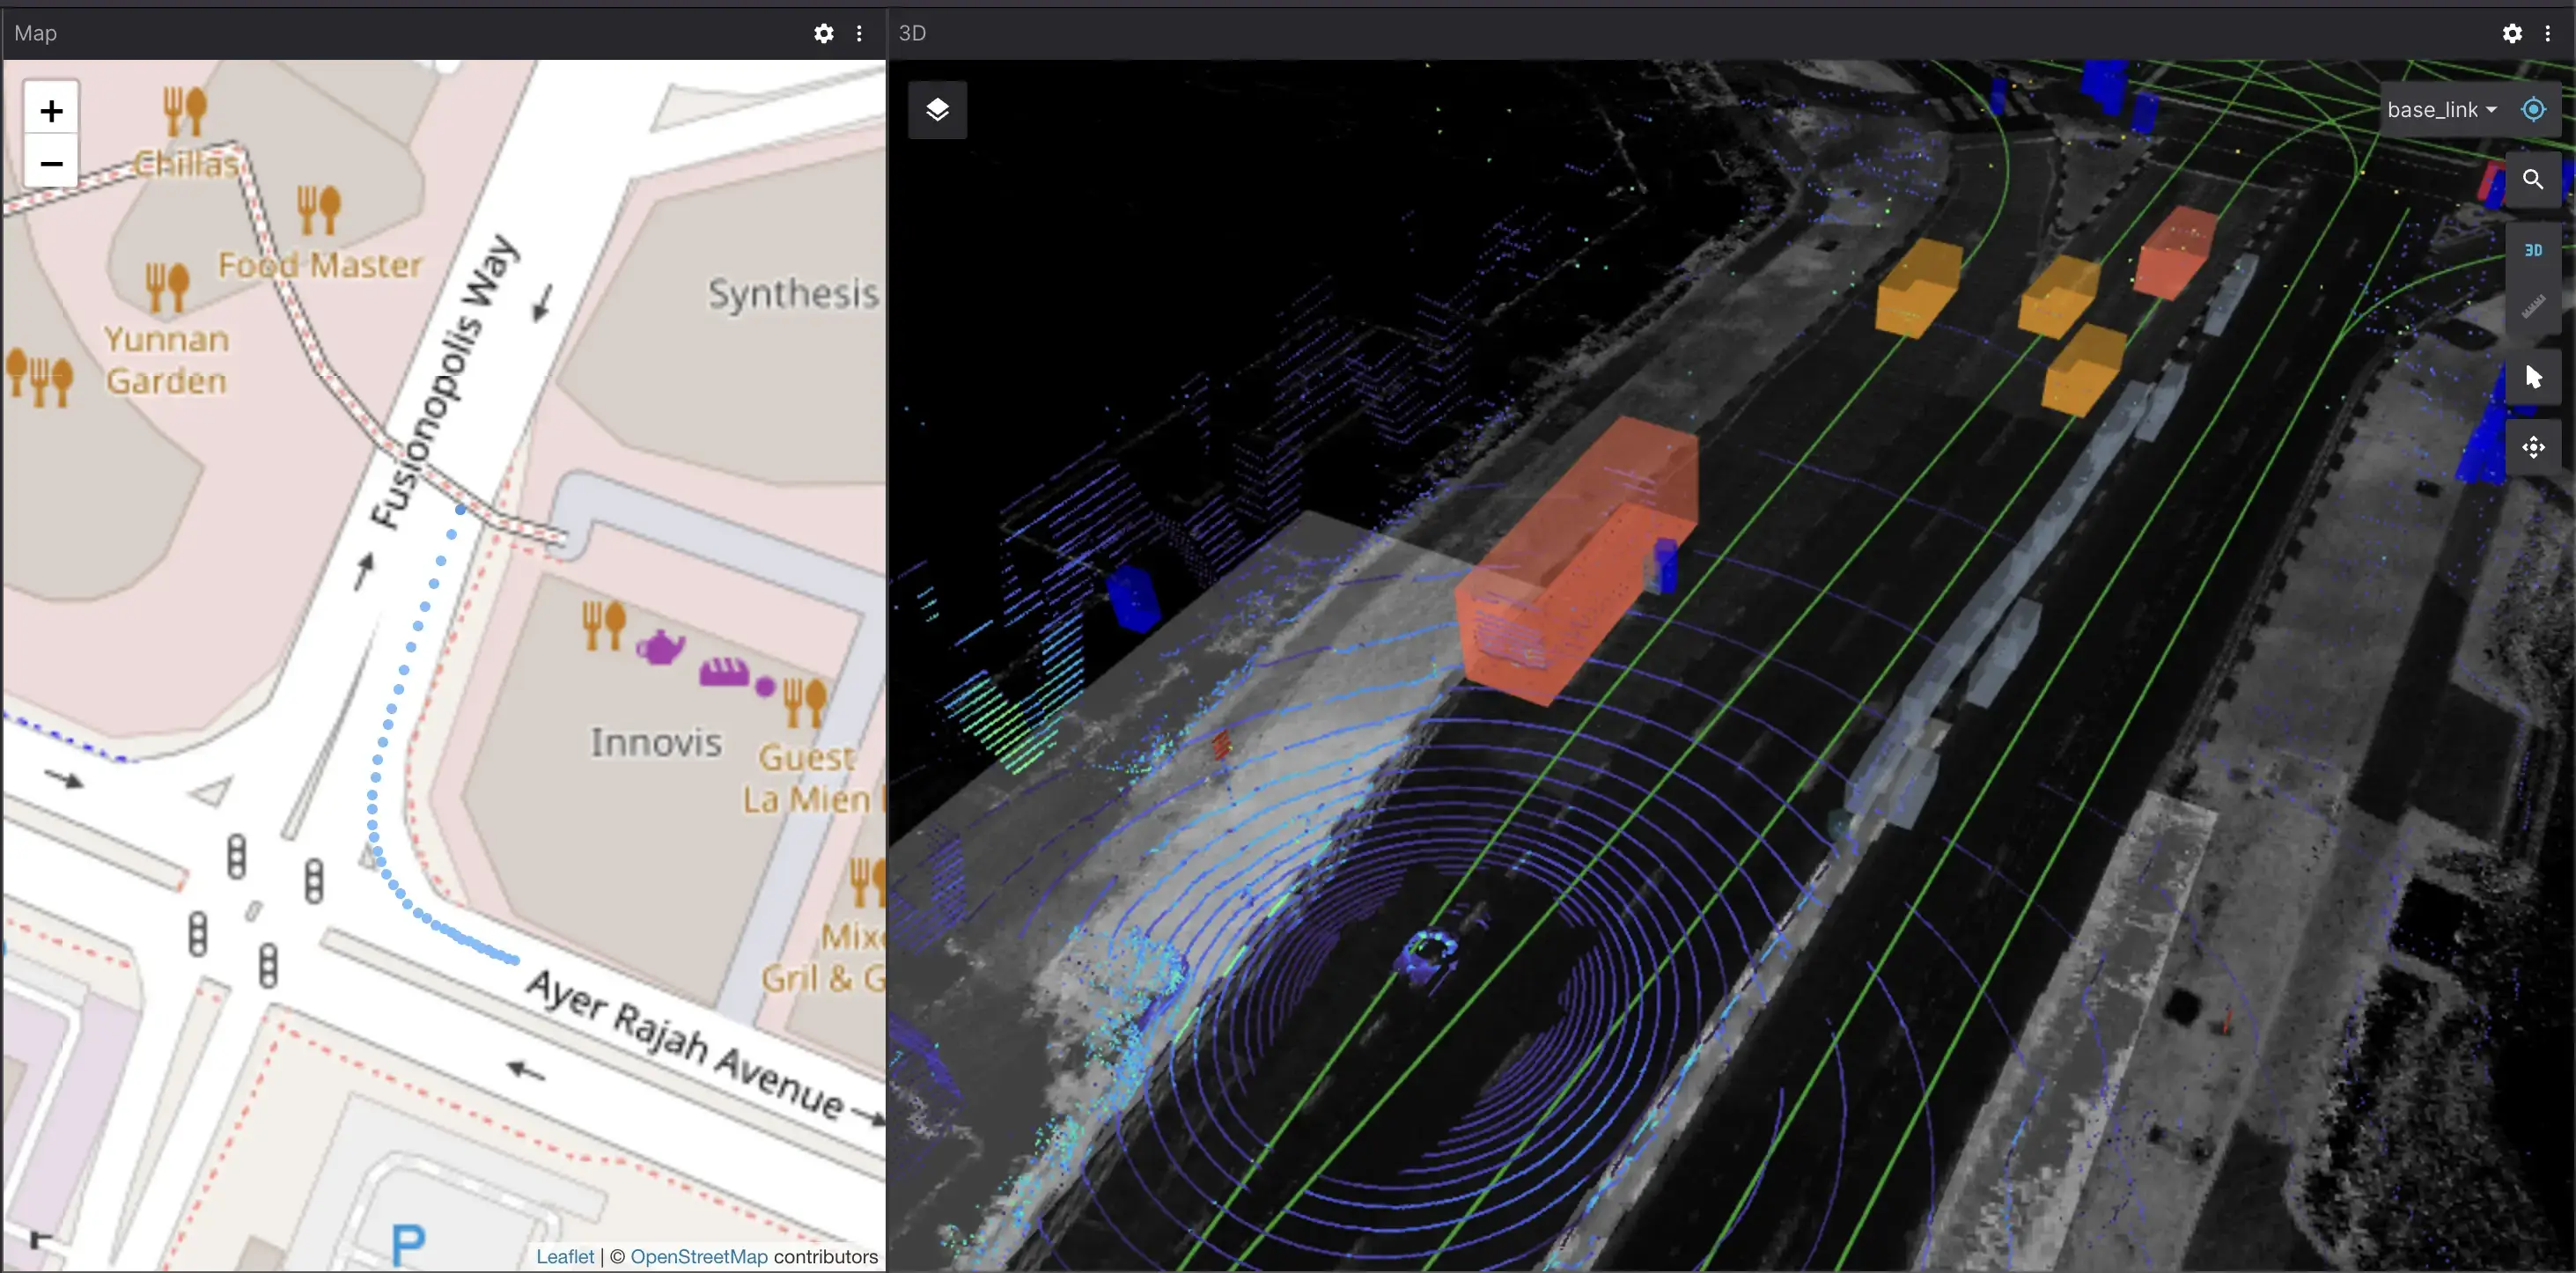
Visualize more types of 3D data with an easier-to-use interface
Create project-specific visualization tools for your robotics team
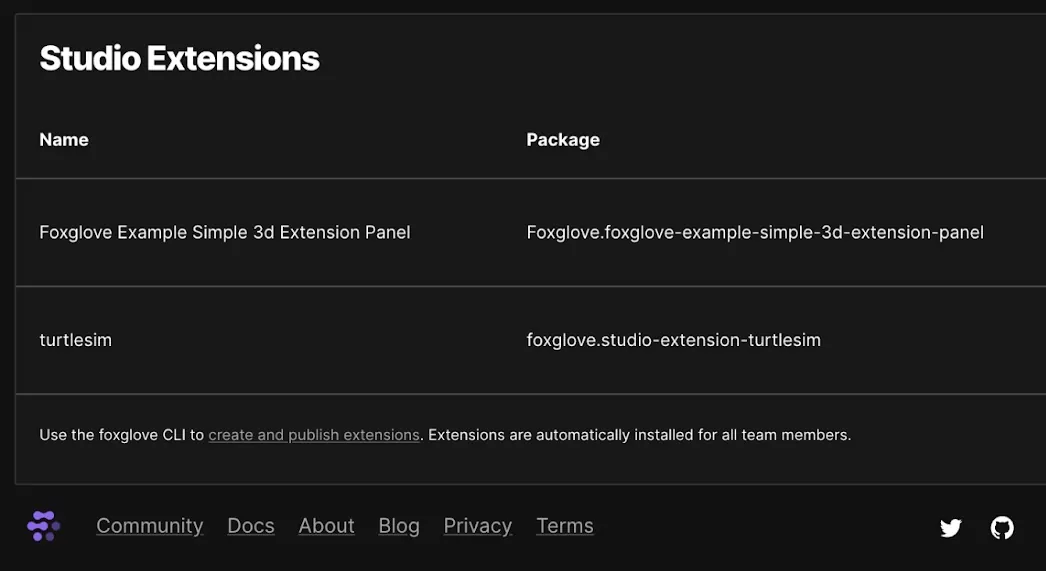
Share custom visualization tools with your teammates
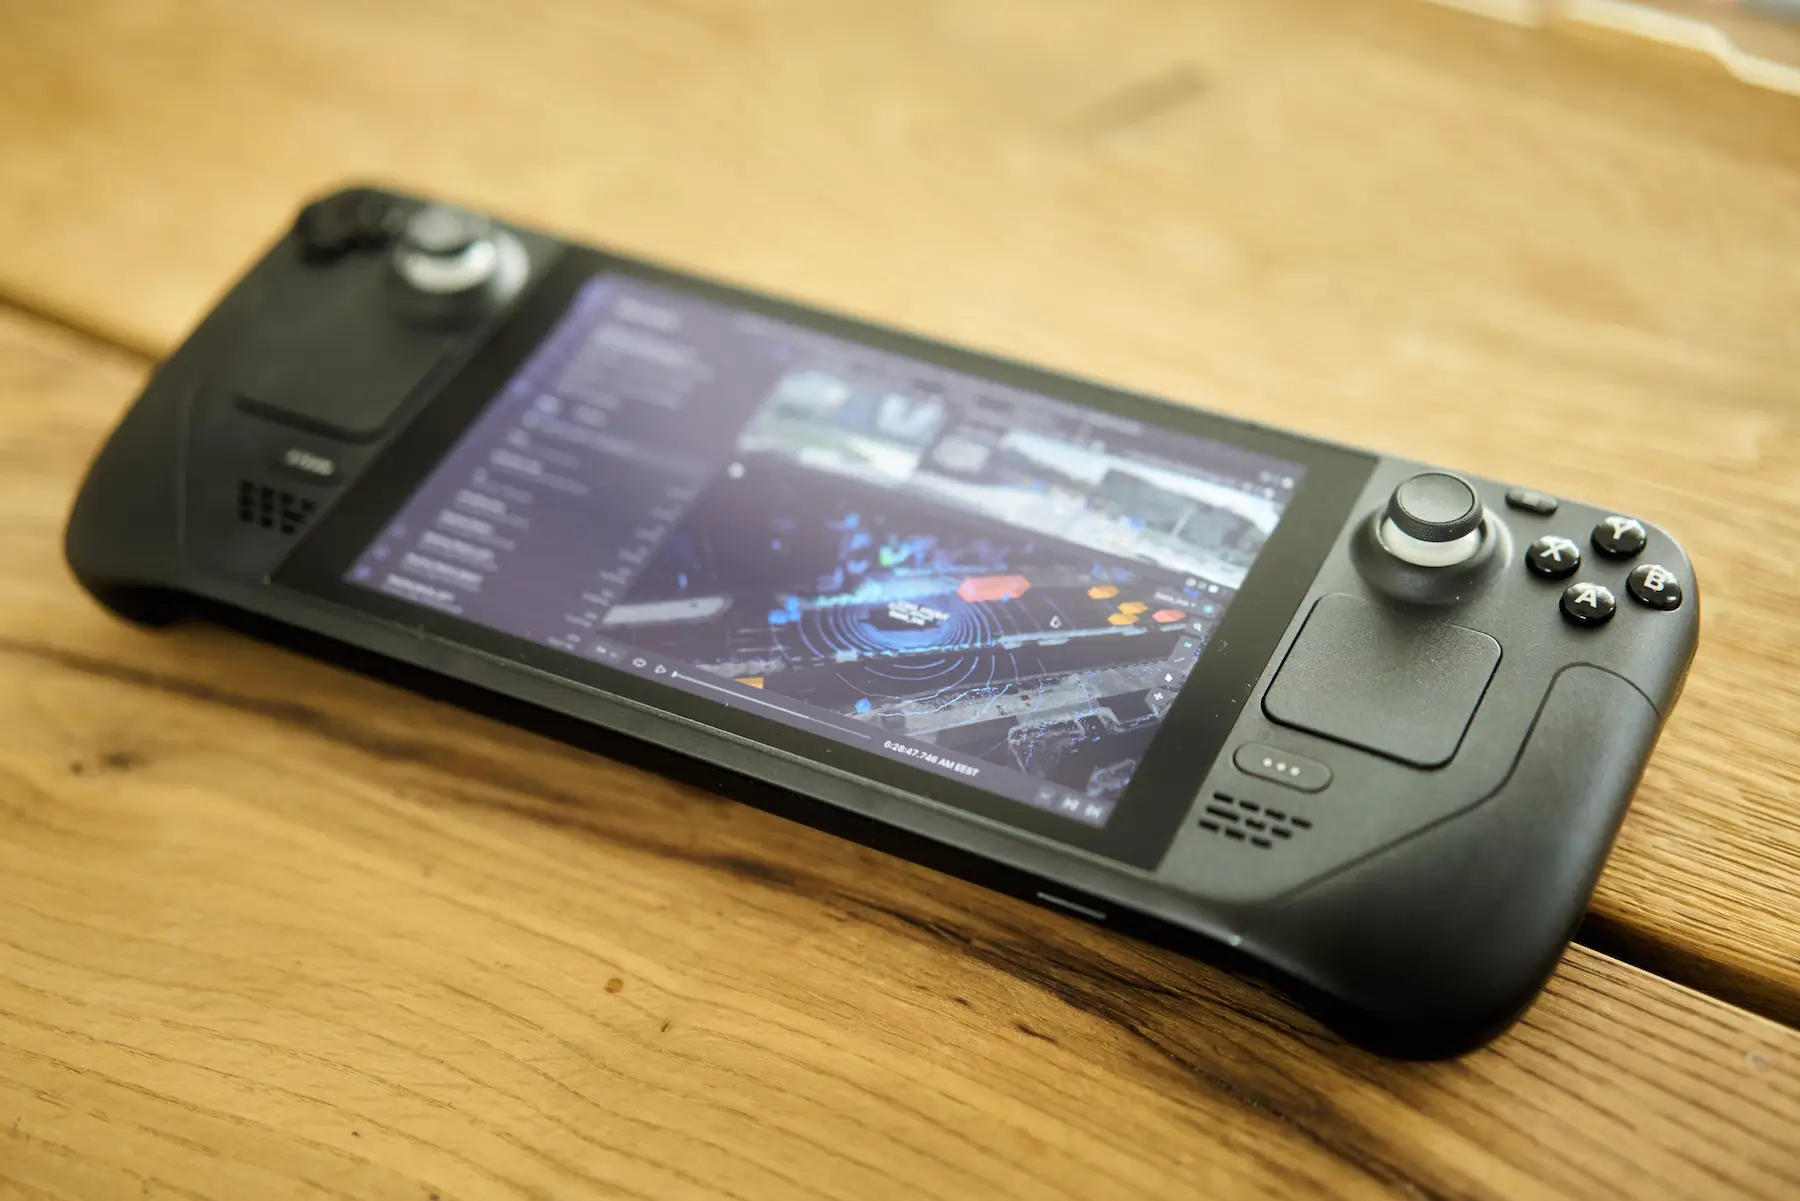
Install Foxglove on any Linux machine with a single command
Write messages in the JSON or Protobuf format for easy visualization in Foxglove
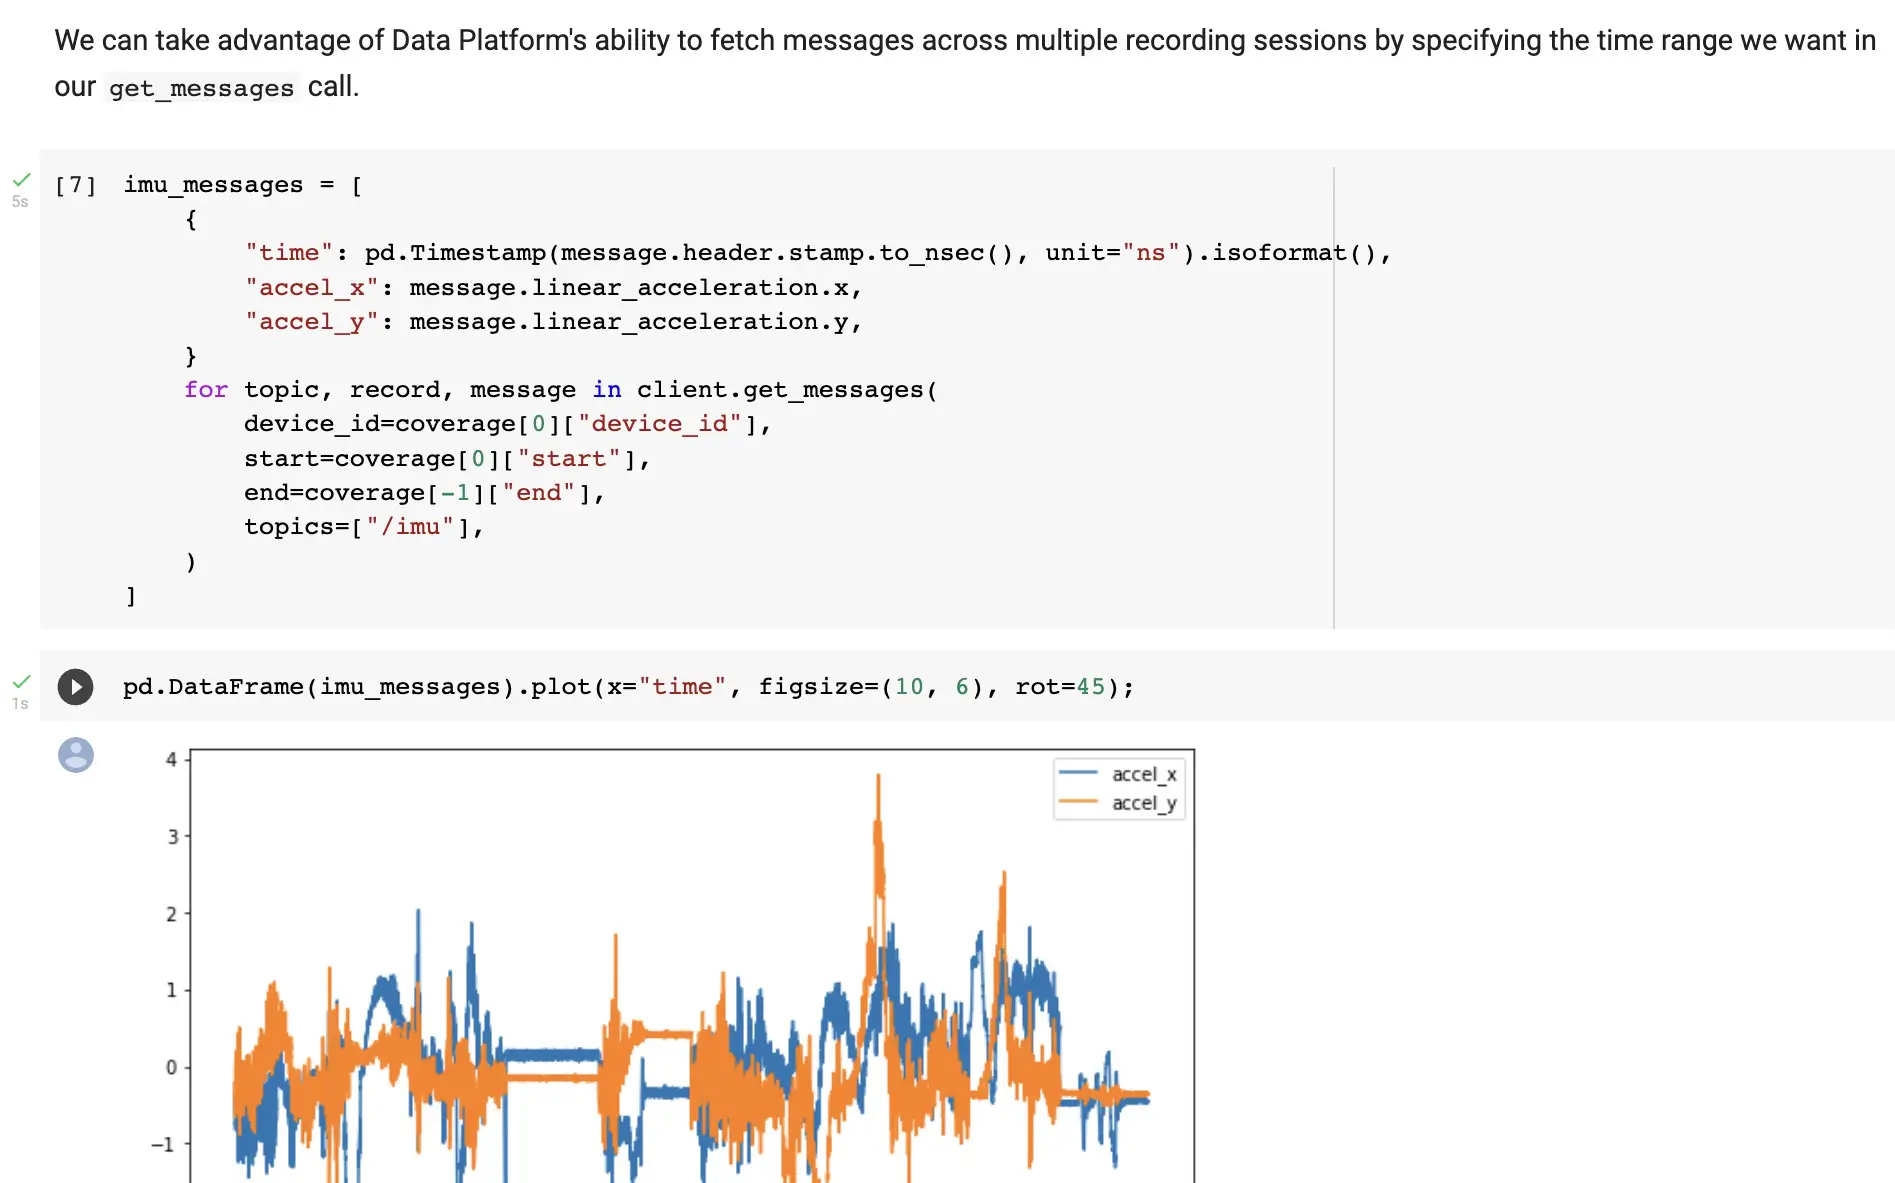
Connect Foxglove to your Jupyter Notebooks
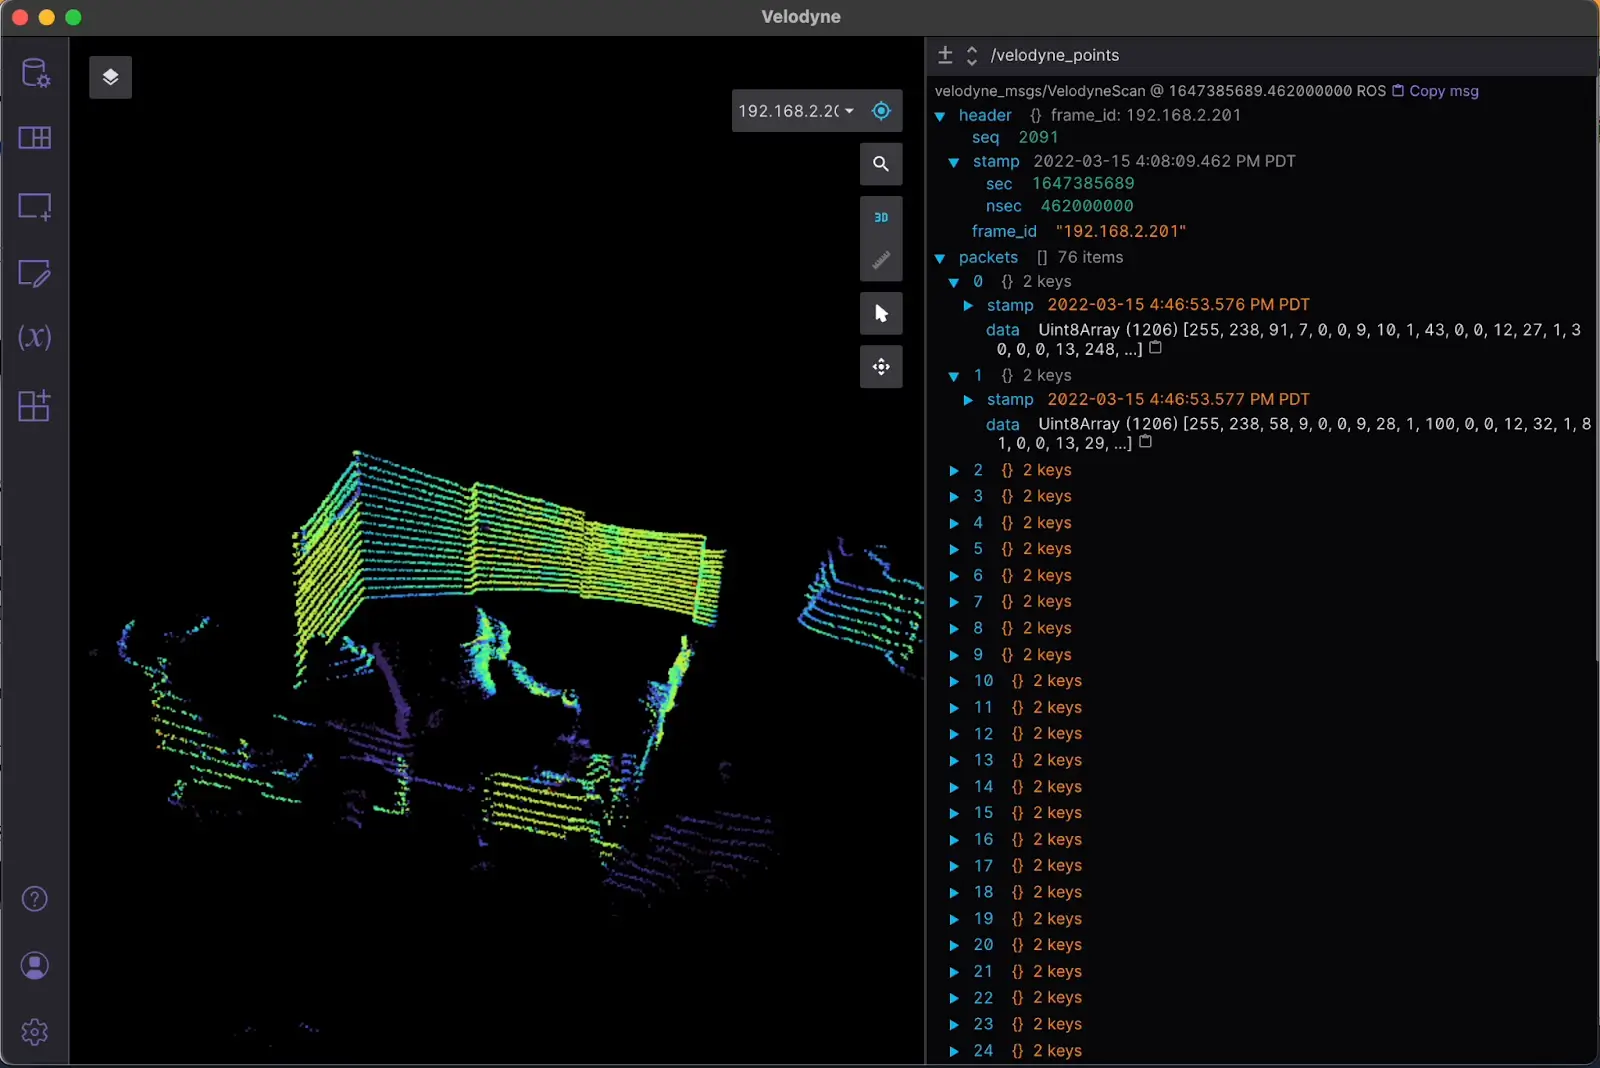
Calibrate your LIDAR sensors with Foxglove
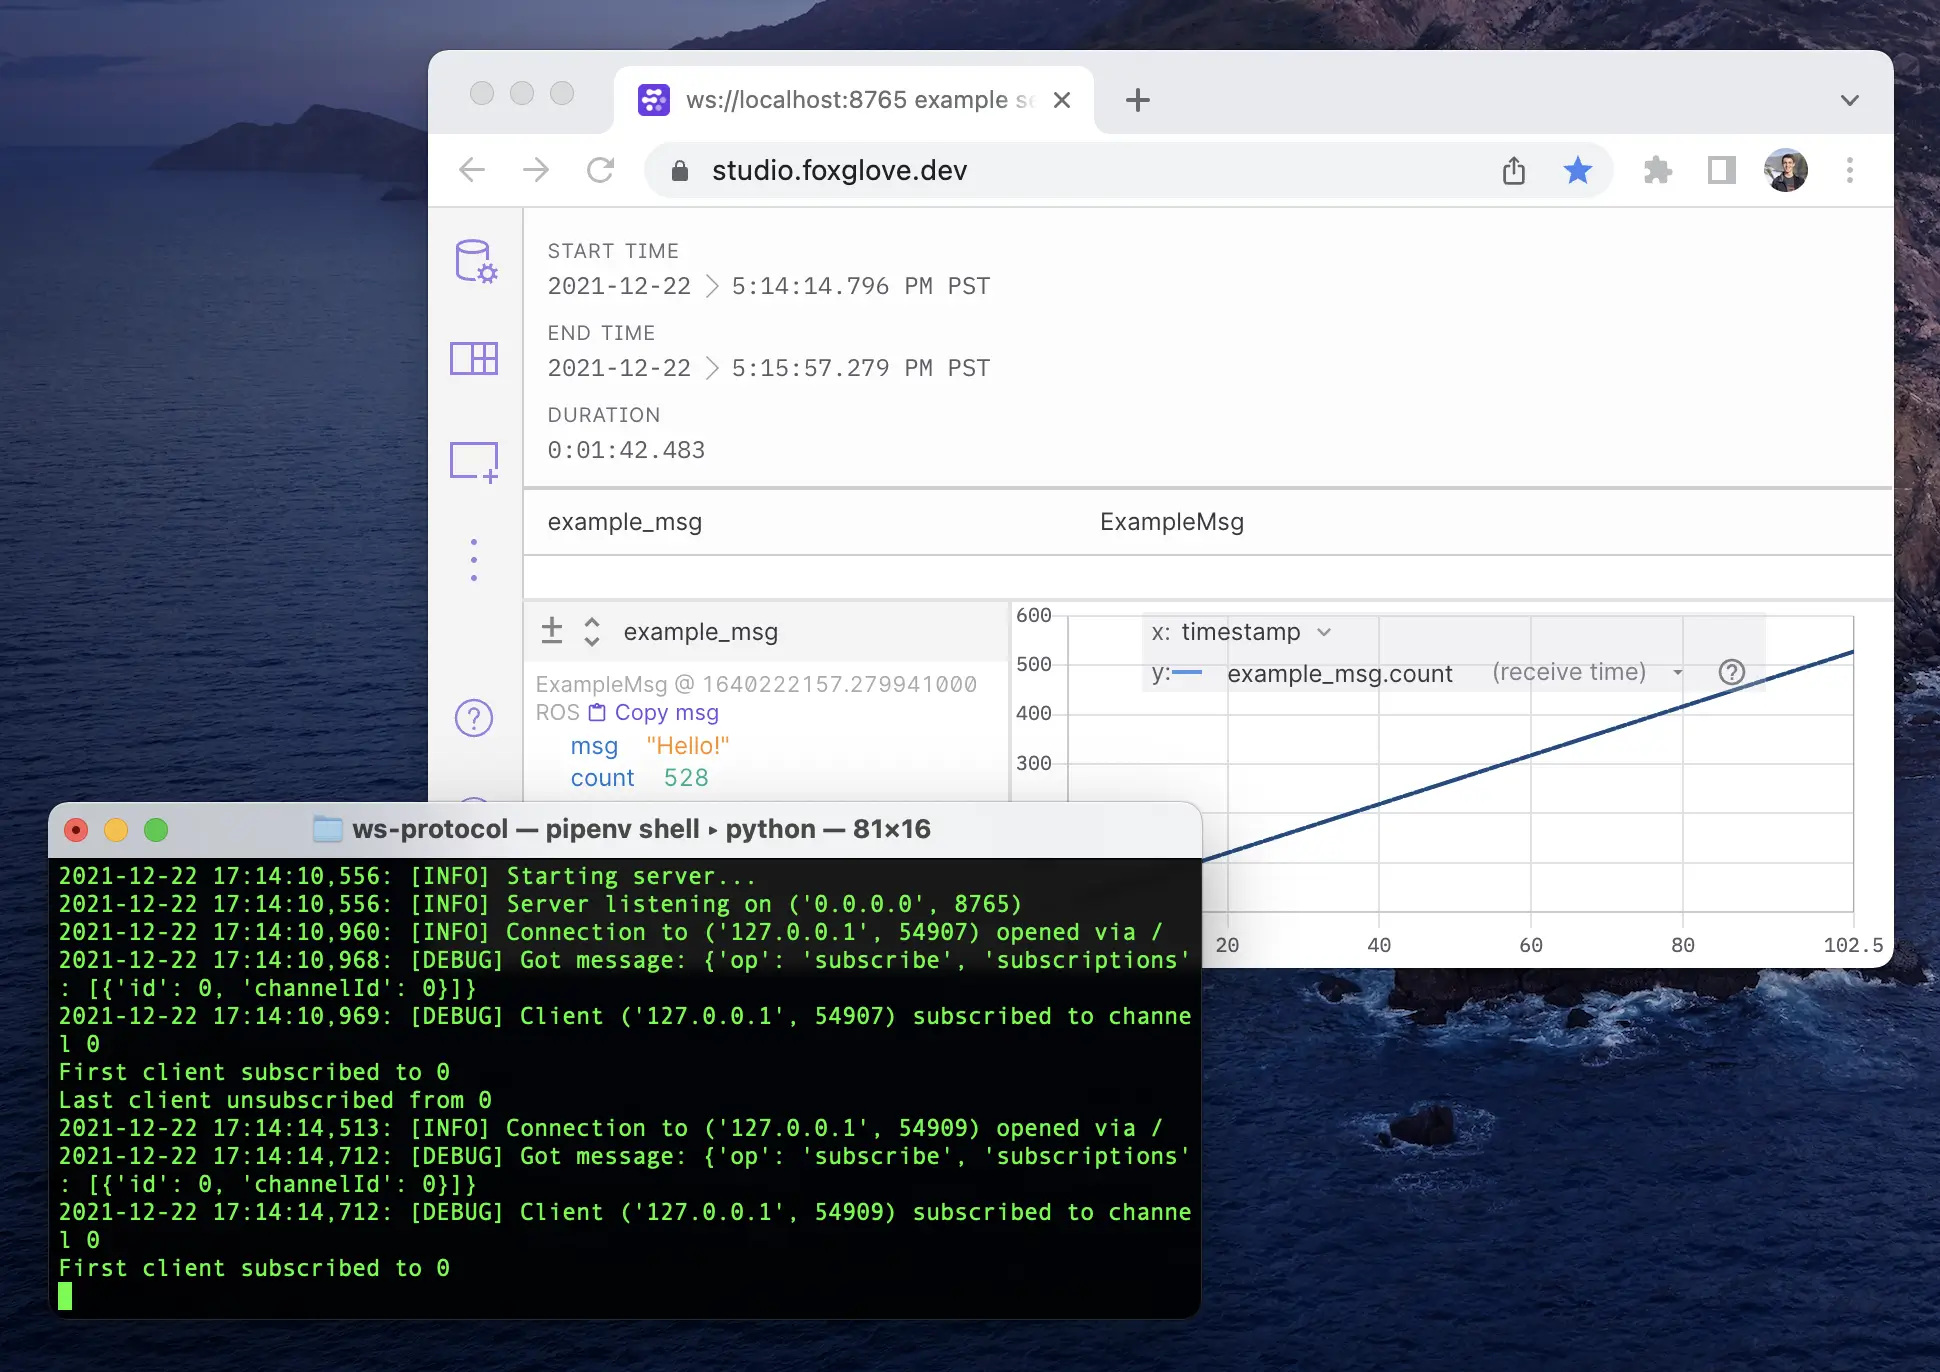
Write a simple WebSocket server that loads Protobuf data into Foxglove
Load JSON, Protobuf, or other custom data into Foxglove
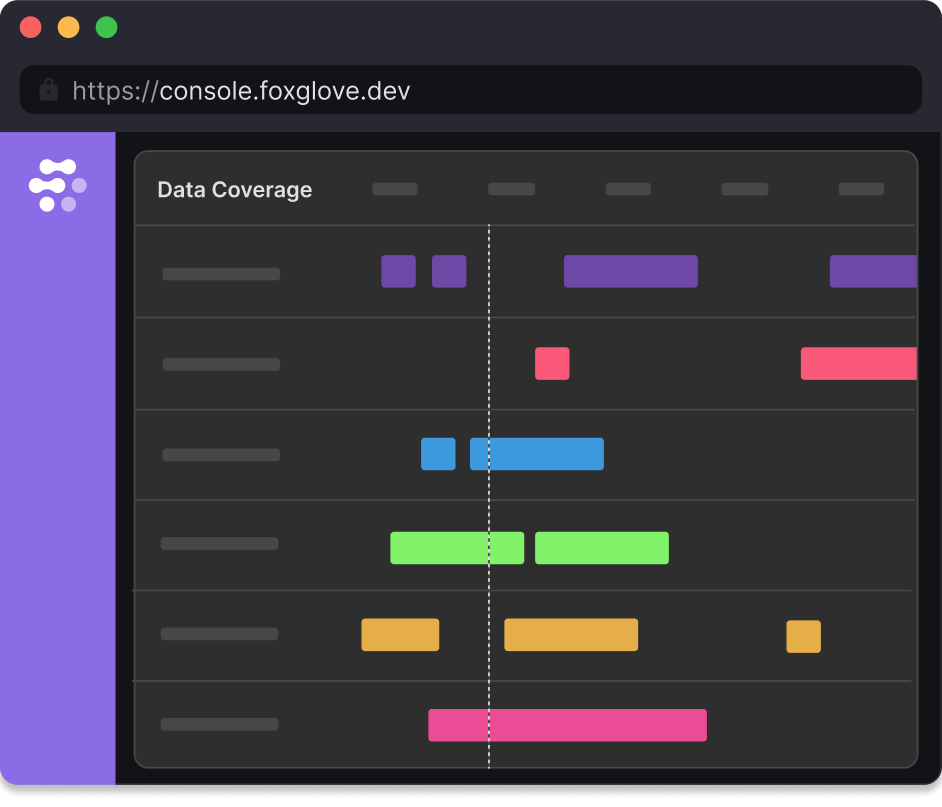
Organize petabytes of data for easy discovery and analysis
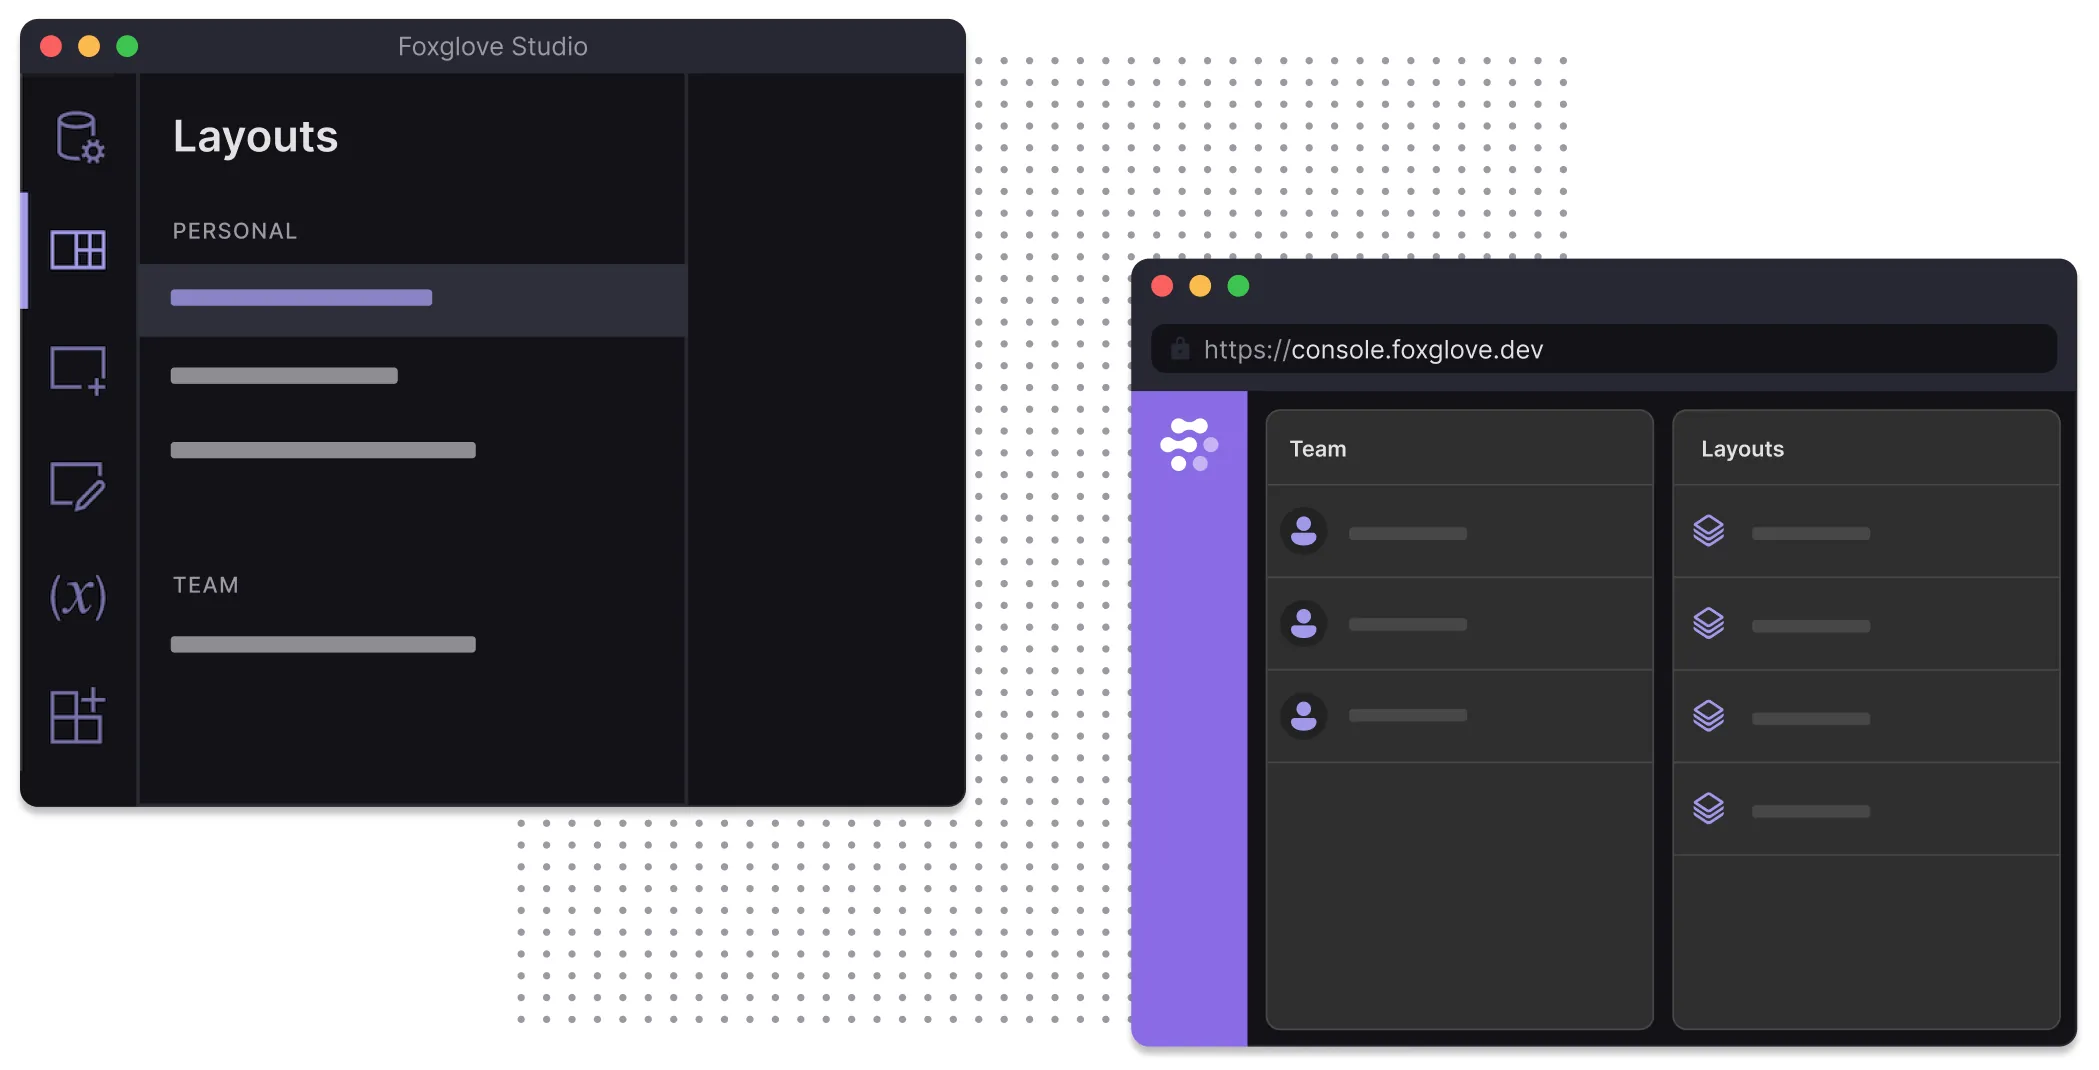
Share insights across your robotics organization with Shared Layouts
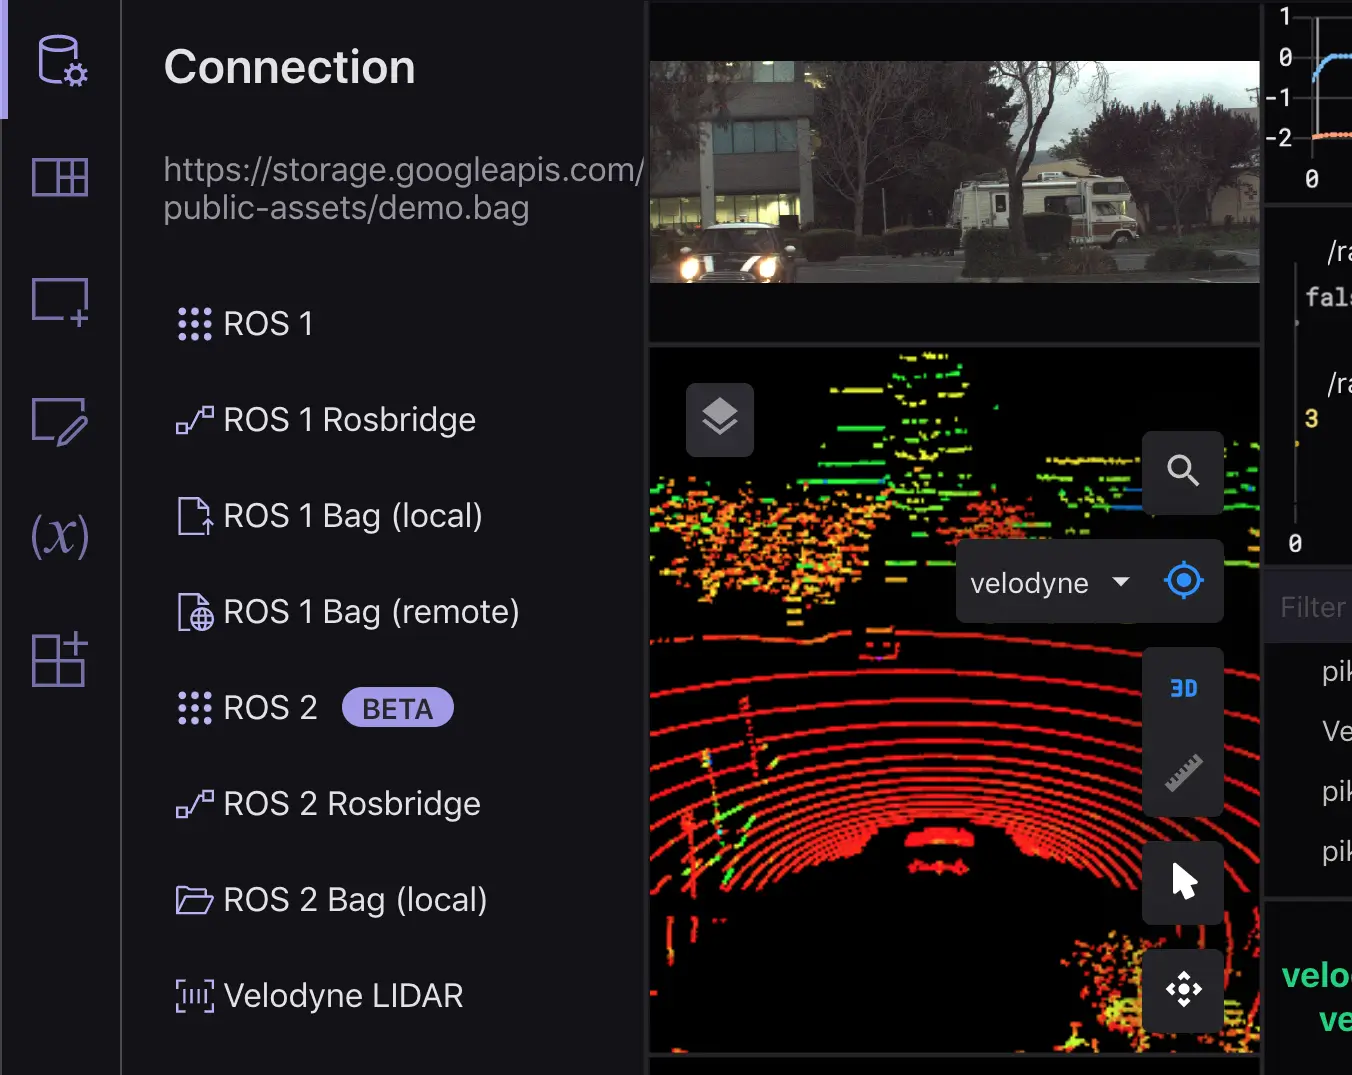
Connect to your ROS 2 stack to visualize your robots' data in real time
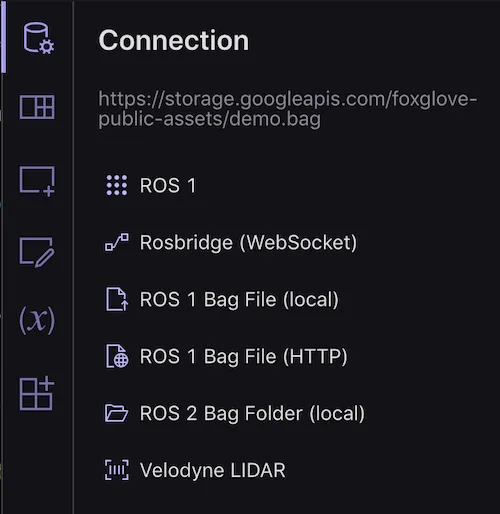
Loading ROS 2 bag files for playback and visualization inside Foxglove
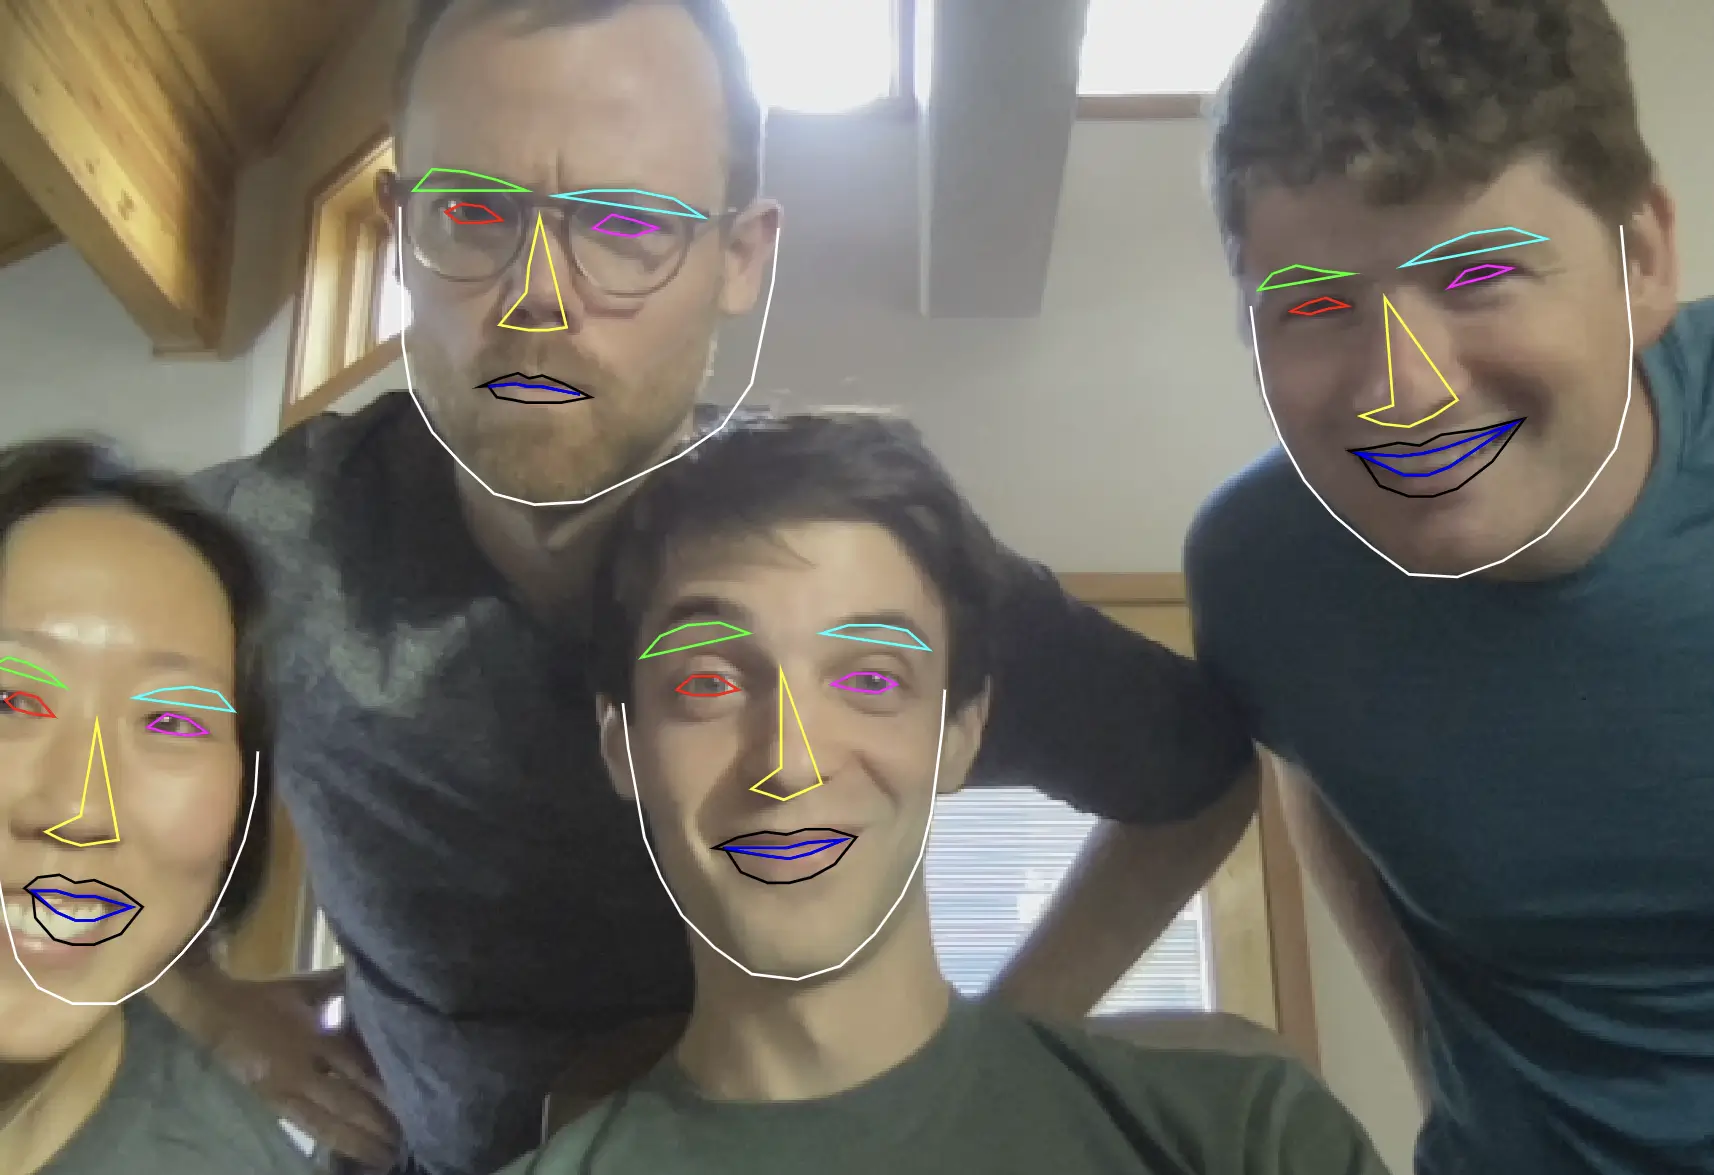
Translate image detection outputs into human-readable visualizations
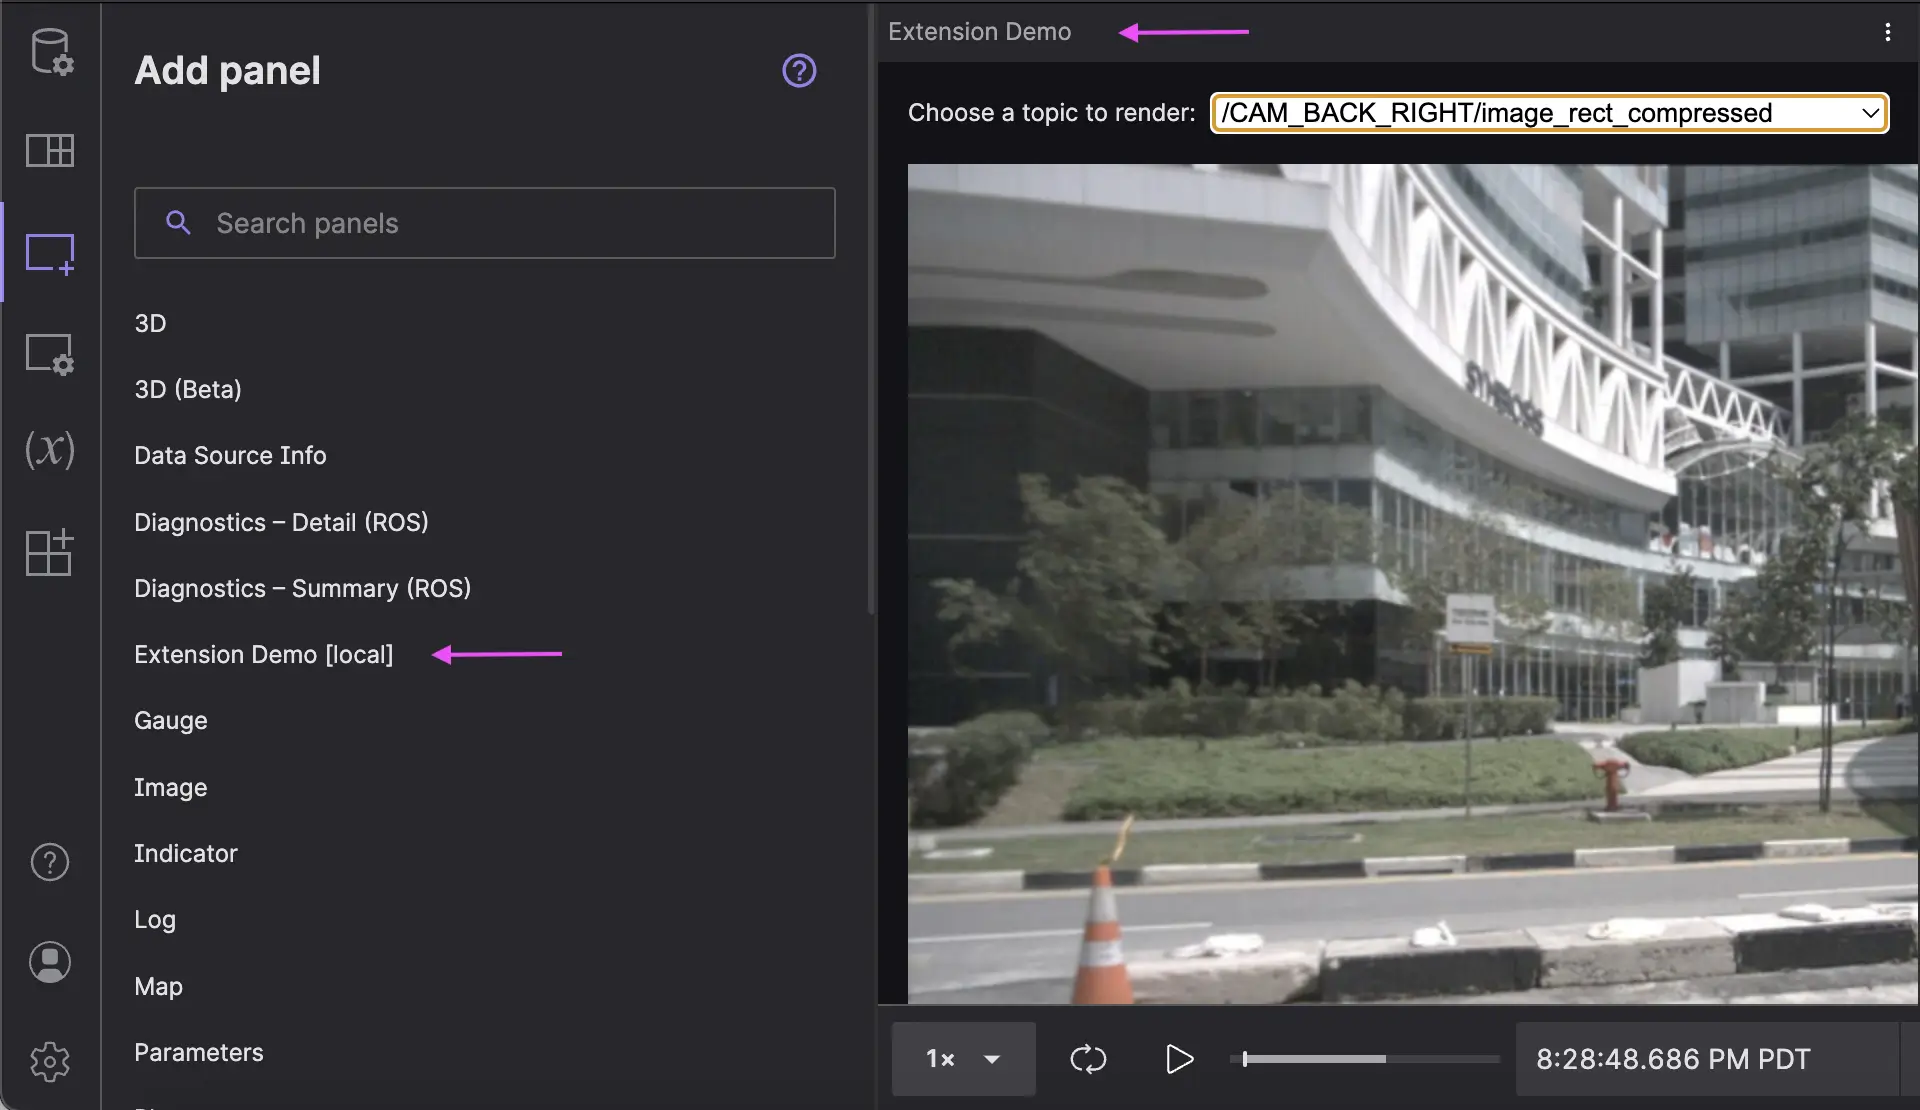
Use the extensions API to build panels customized to your project
No posts found.