Visualizing Depth Maps and Pointclouds from the OAK-D S2 in Foxglove
CommunityTutorialJun 18, 2026
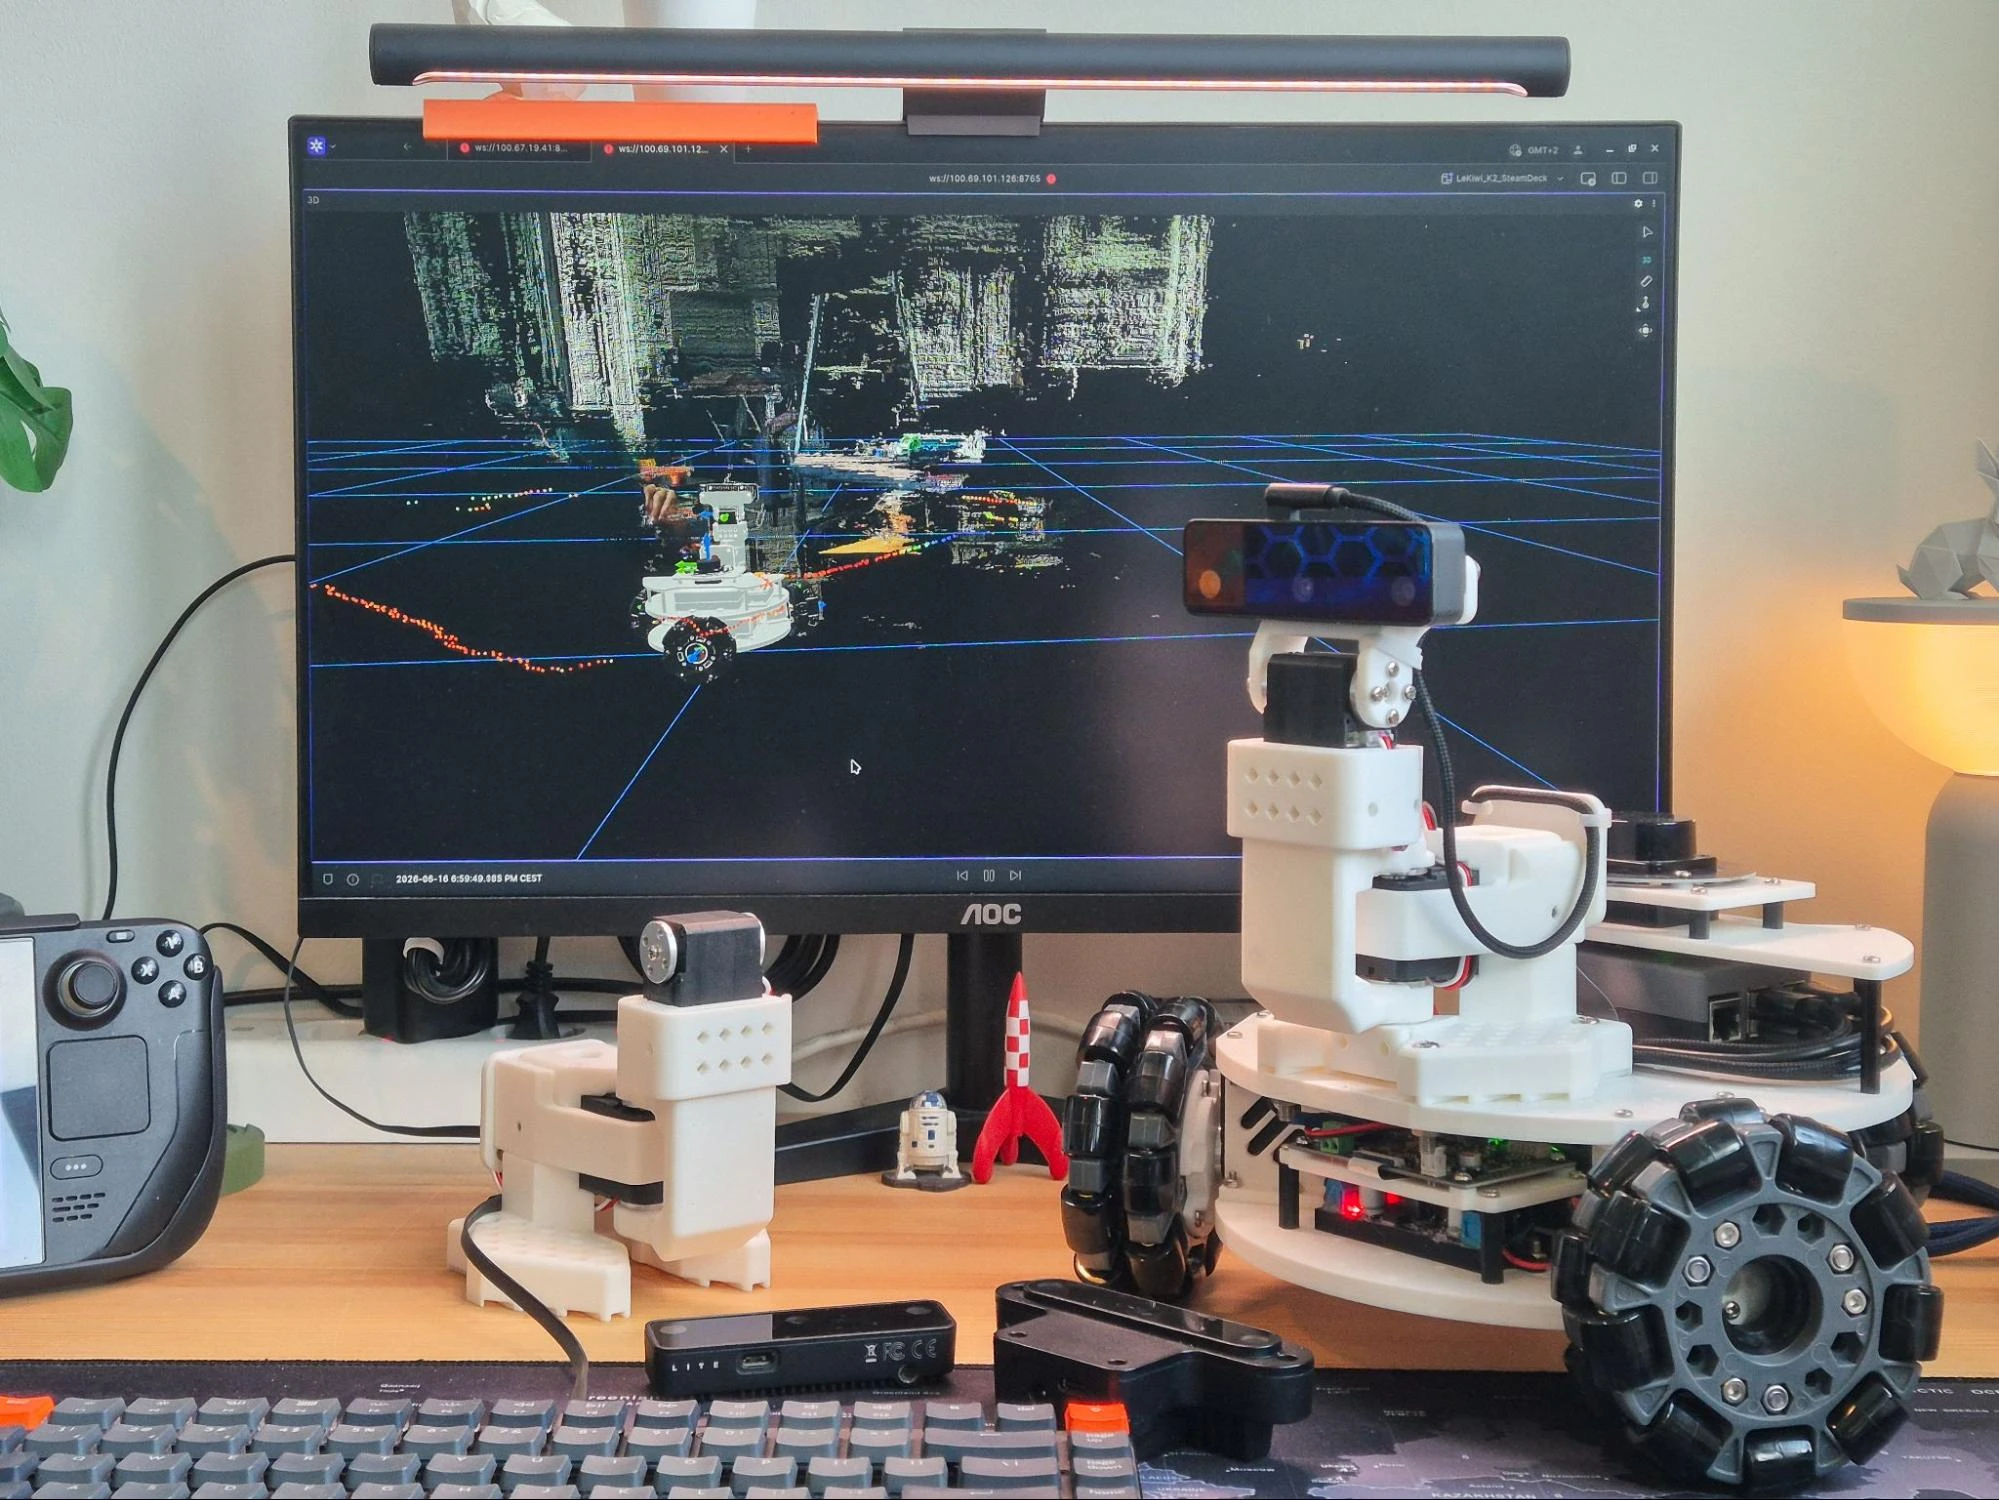
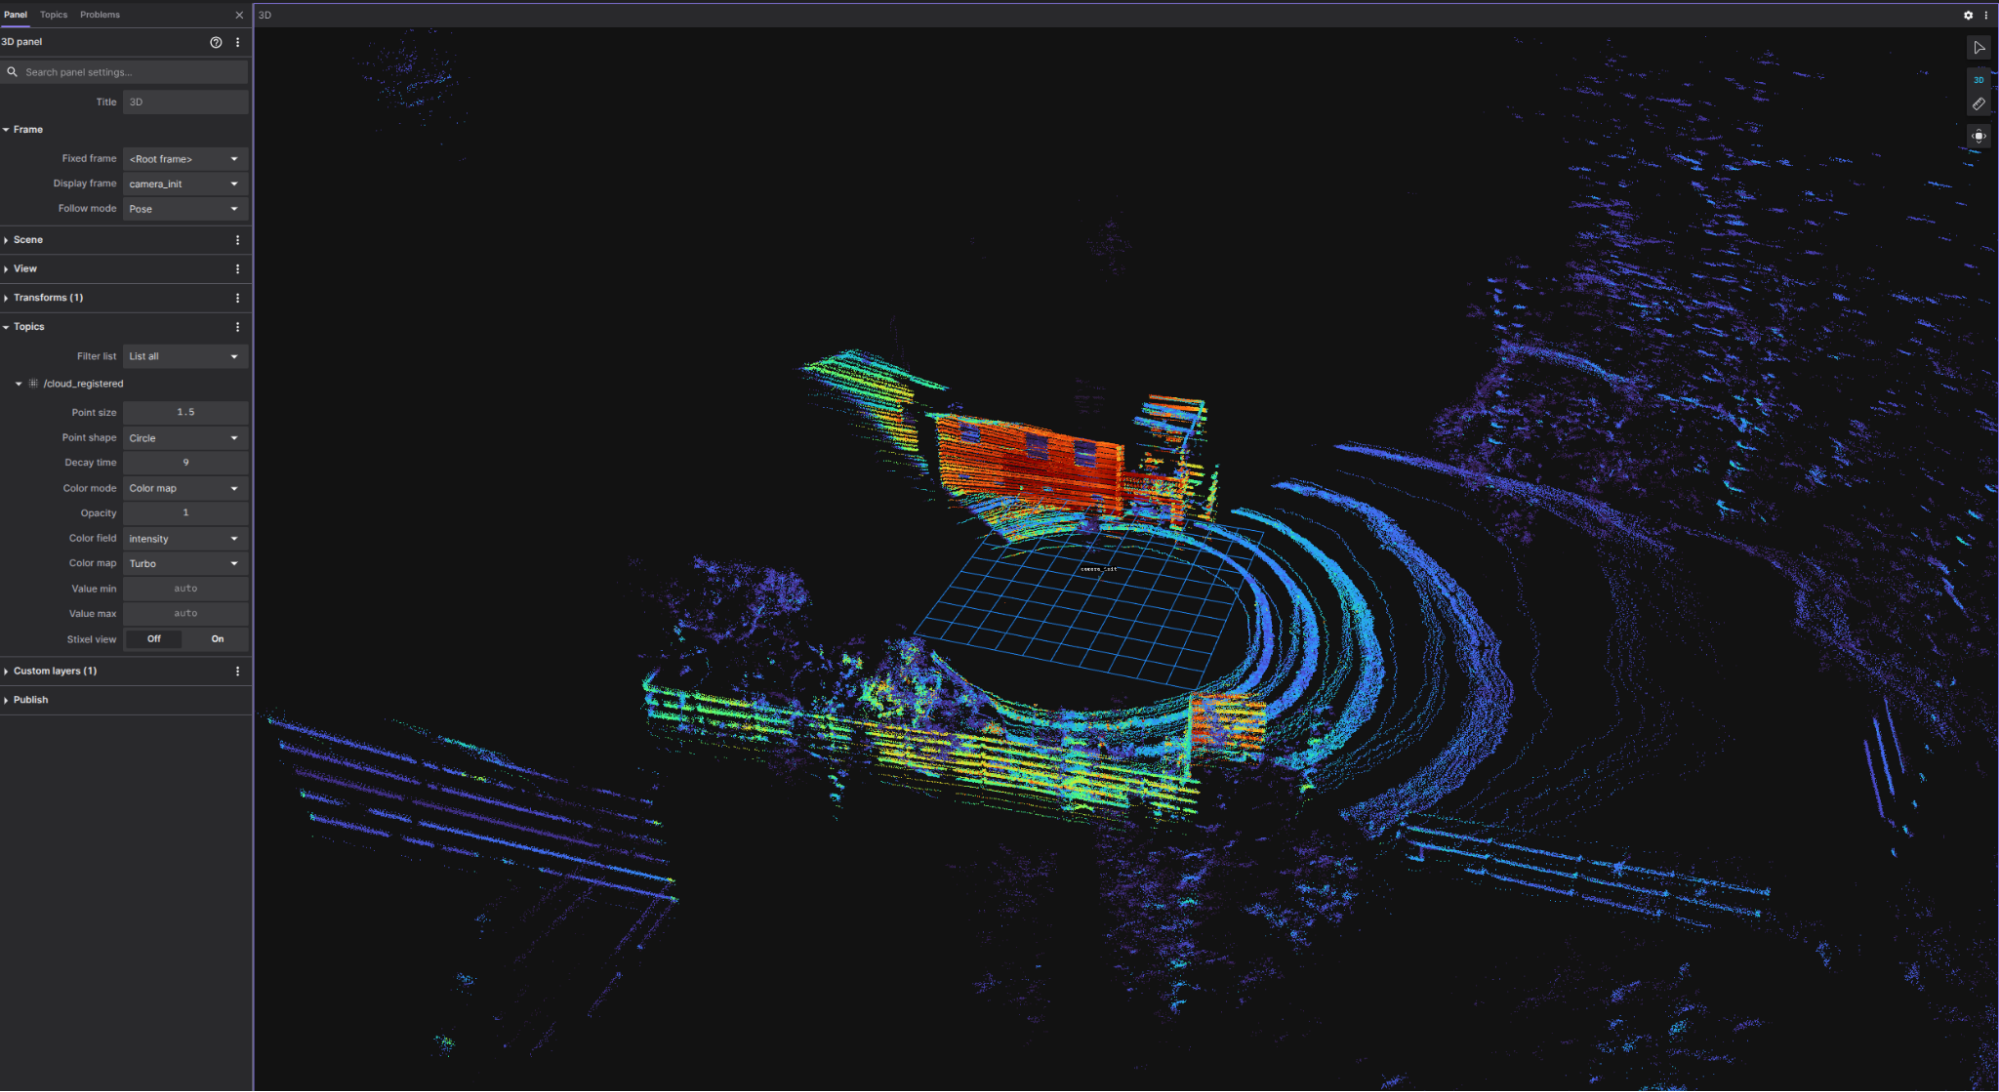
How I integrated a Luxonis OAK-D S2 stereo depth camera into my LeKiwi robot's ROS 2 stack — configuring the depthai-ros driver for low bandwidth, compressing pointclouds with Cloudini, and visualizing RGB images, depth maps, and pointclouds in Foxglove's 3D panel.